29
/
en
AIzaSyAYiBZKx7MnpbEhh9jyipgxe19OcubqV5w
April 1, 2024
227711
Qatar
QAT
true
2
1
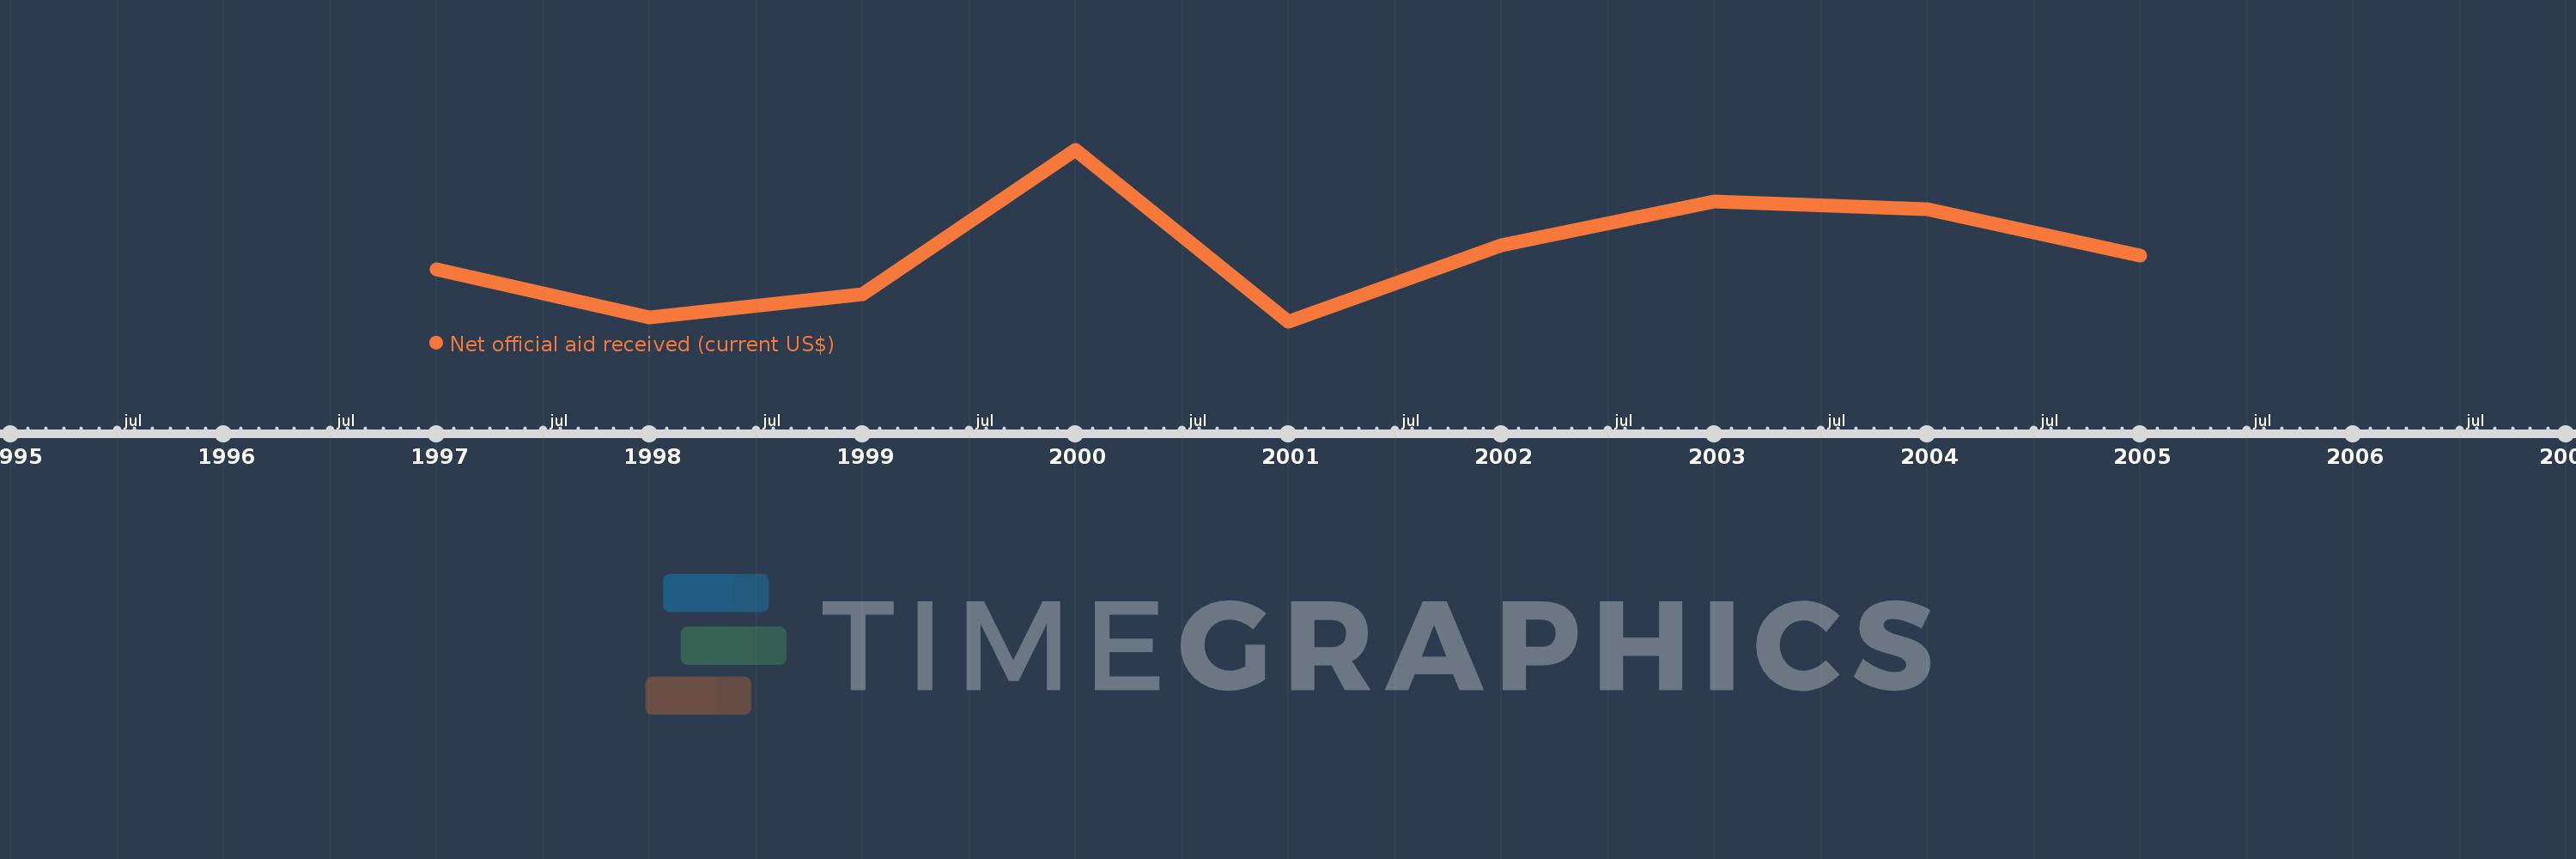
Net official aid received (current US$)
2005,2004,2003,2002,2001,2000,1999,1998,1997
This statistics in other country:
Timeline:
This timeline shows a graph from 1997 to 2005 of Qatar. No data until 1996. Number of actual observations by date: 9.
Source name:
World Development Indicators
Source organization:
Development Assistance Committee of the Organisation for Economic Co-operation and Development, Geographical Distribution of Financial Flows to Developing Countries, Development Co-operation Report, and International Development Statistics database. Data are available online at: www.oecd.org/dac/stats/idsonline.
Categories, topics:
Aid Effectiveness
Last updated:
apr 23, 2017
Indicators value changes by year
Minimum:
1.94 mln
jan 1, 2001
Maximum:
6.34 mln
jan 1, 2000
At the date of observation
Value
Absolute change
Change from previous value
jan 1, 1997
3.28 mln
+3.28 mln
0.0%
jan 1, 1998
2.06 mln
-1.22 mln
-37.2%
jan 1, 1999
2.66 mln
+600.0K
29.13%
jan 1, 2000
6.34 mln
+3.68 mln
138.35%
jan 1, 2001
1.94 mln
-4.4 mln
-69.4%
jan 1, 2002
3.91 mln
+1.97 mln
101.55%
jan 1, 2003
5.02 mln
+1.11 mln
28.39%
jan 1, 2004
4.82 mln
-200.0K
-3.98%
jan 1, 2005
3.63 mln
-1.19 mln
-24.69%
Ranking of countries by current statistics by years


Comments: