This statistics in other country:
Timeline:
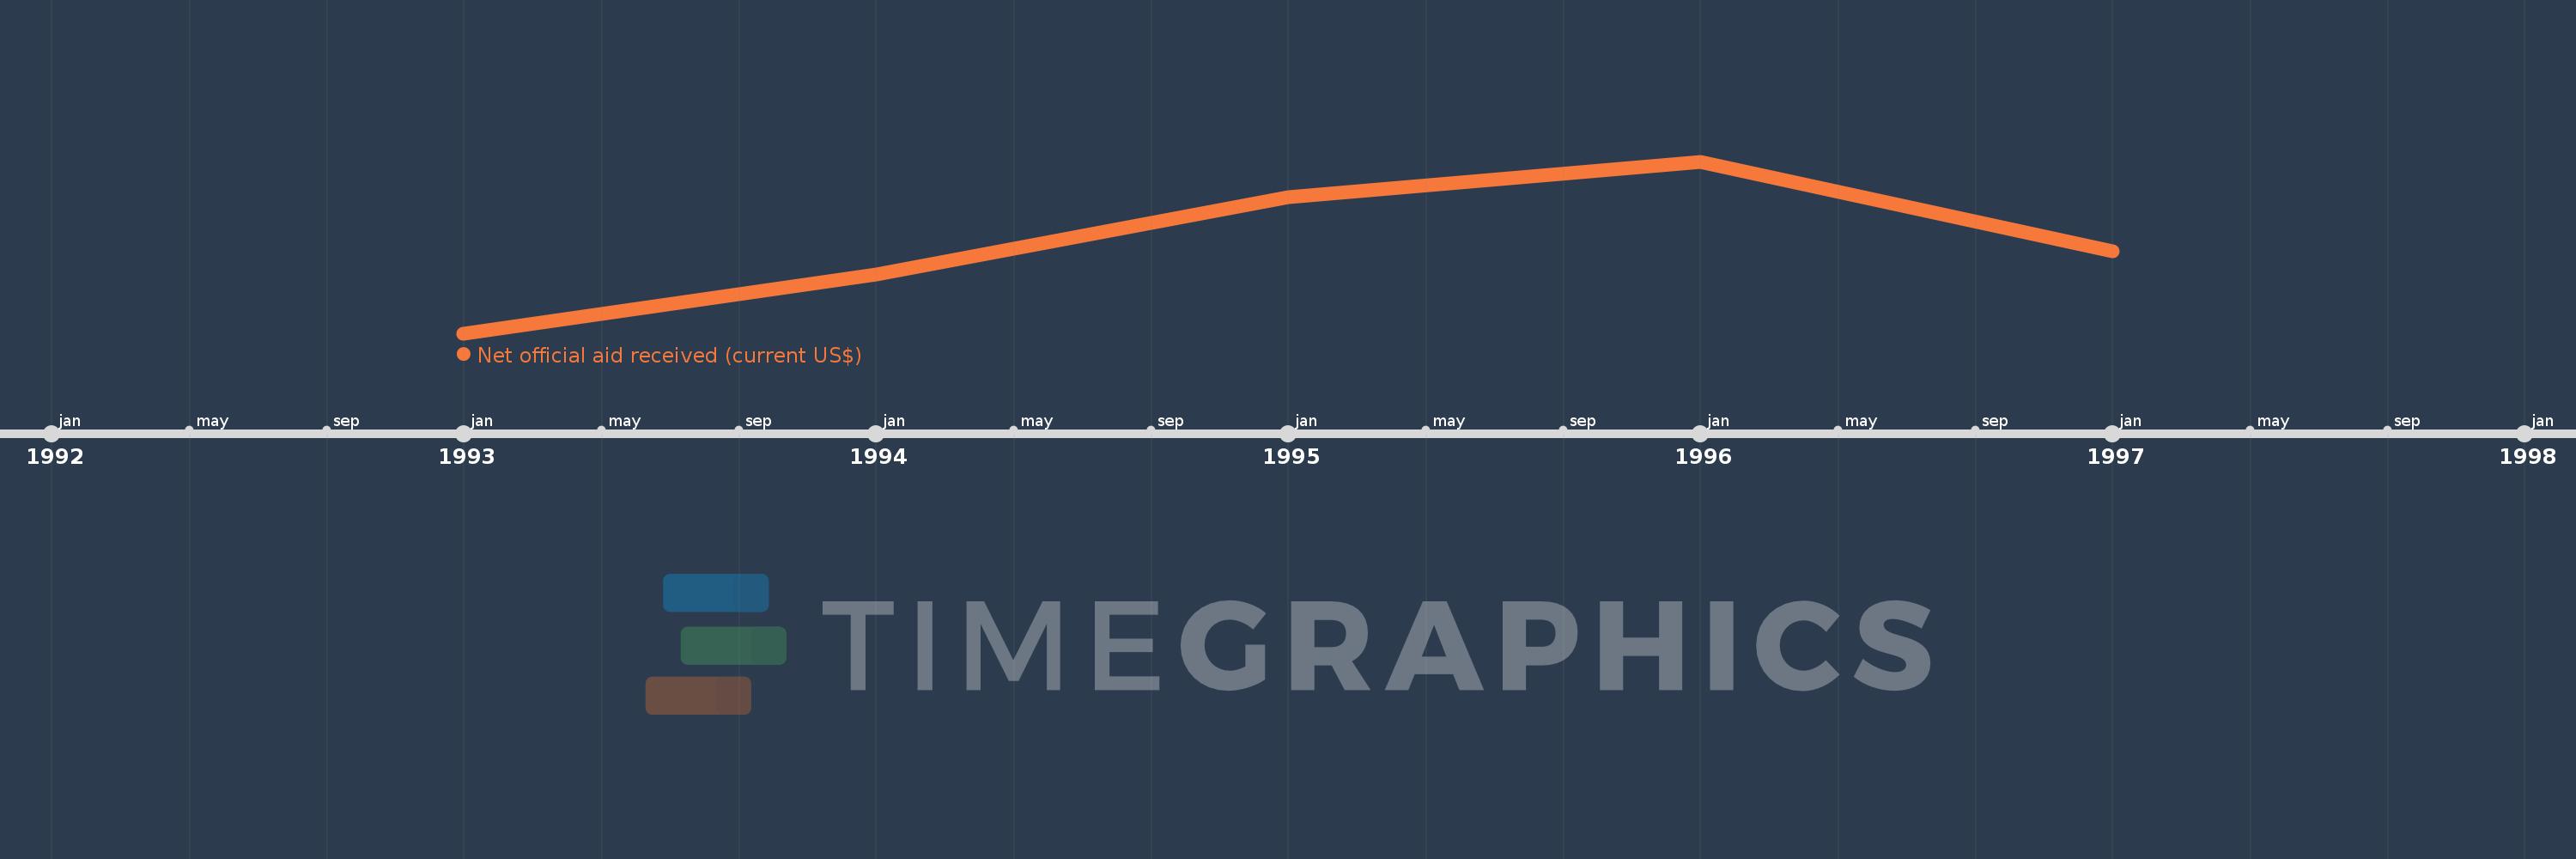
This timeline shows a graph from 1993 to 1997 of IDA blend. No data until 1992. Number of actual observations by date: 5.
Source name:
World Development Indicators
Source organization:
Development Assistance Committee of the Organisation for Economic Co-operation and Development, Geographical Distribution of Financial Flows to Developing Countries, Development Co-operation Report, and International Development Statistics database. Data are available online at: www.oecd.org/dac/stats/idsonline.
Categories, topics:
Aid Effectiveness
Last updated:
apr 23, 2017
Indicators value changes by year
Minimum:
9.7 mln
jan 1, 1993
Maximum:
65.82 mln
jan 1, 1996
At the date of observation
Value
Absolute change
Change from previous value
jan 1, 1993
9.7 mln
+9.7 mln
0.0%
jan 1, 1994
28.81 mln
+19.11 mln
197.01%
jan 1, 1995
54.27 mln
+25.46 mln
88.37%
jan 1, 1996
65.82 mln
+11.55 mln
21.28%
jan 1, 1997
36.36 mln
-29.46 mln
-44.76%
Ranking of countries by current statistics by years


Comments: