29
/
en
AIzaSyAYiBZKx7MnpbEhh9jyipgxe19OcubqV5w
April 1, 2024
52892
OECD members
OED
false
2
1
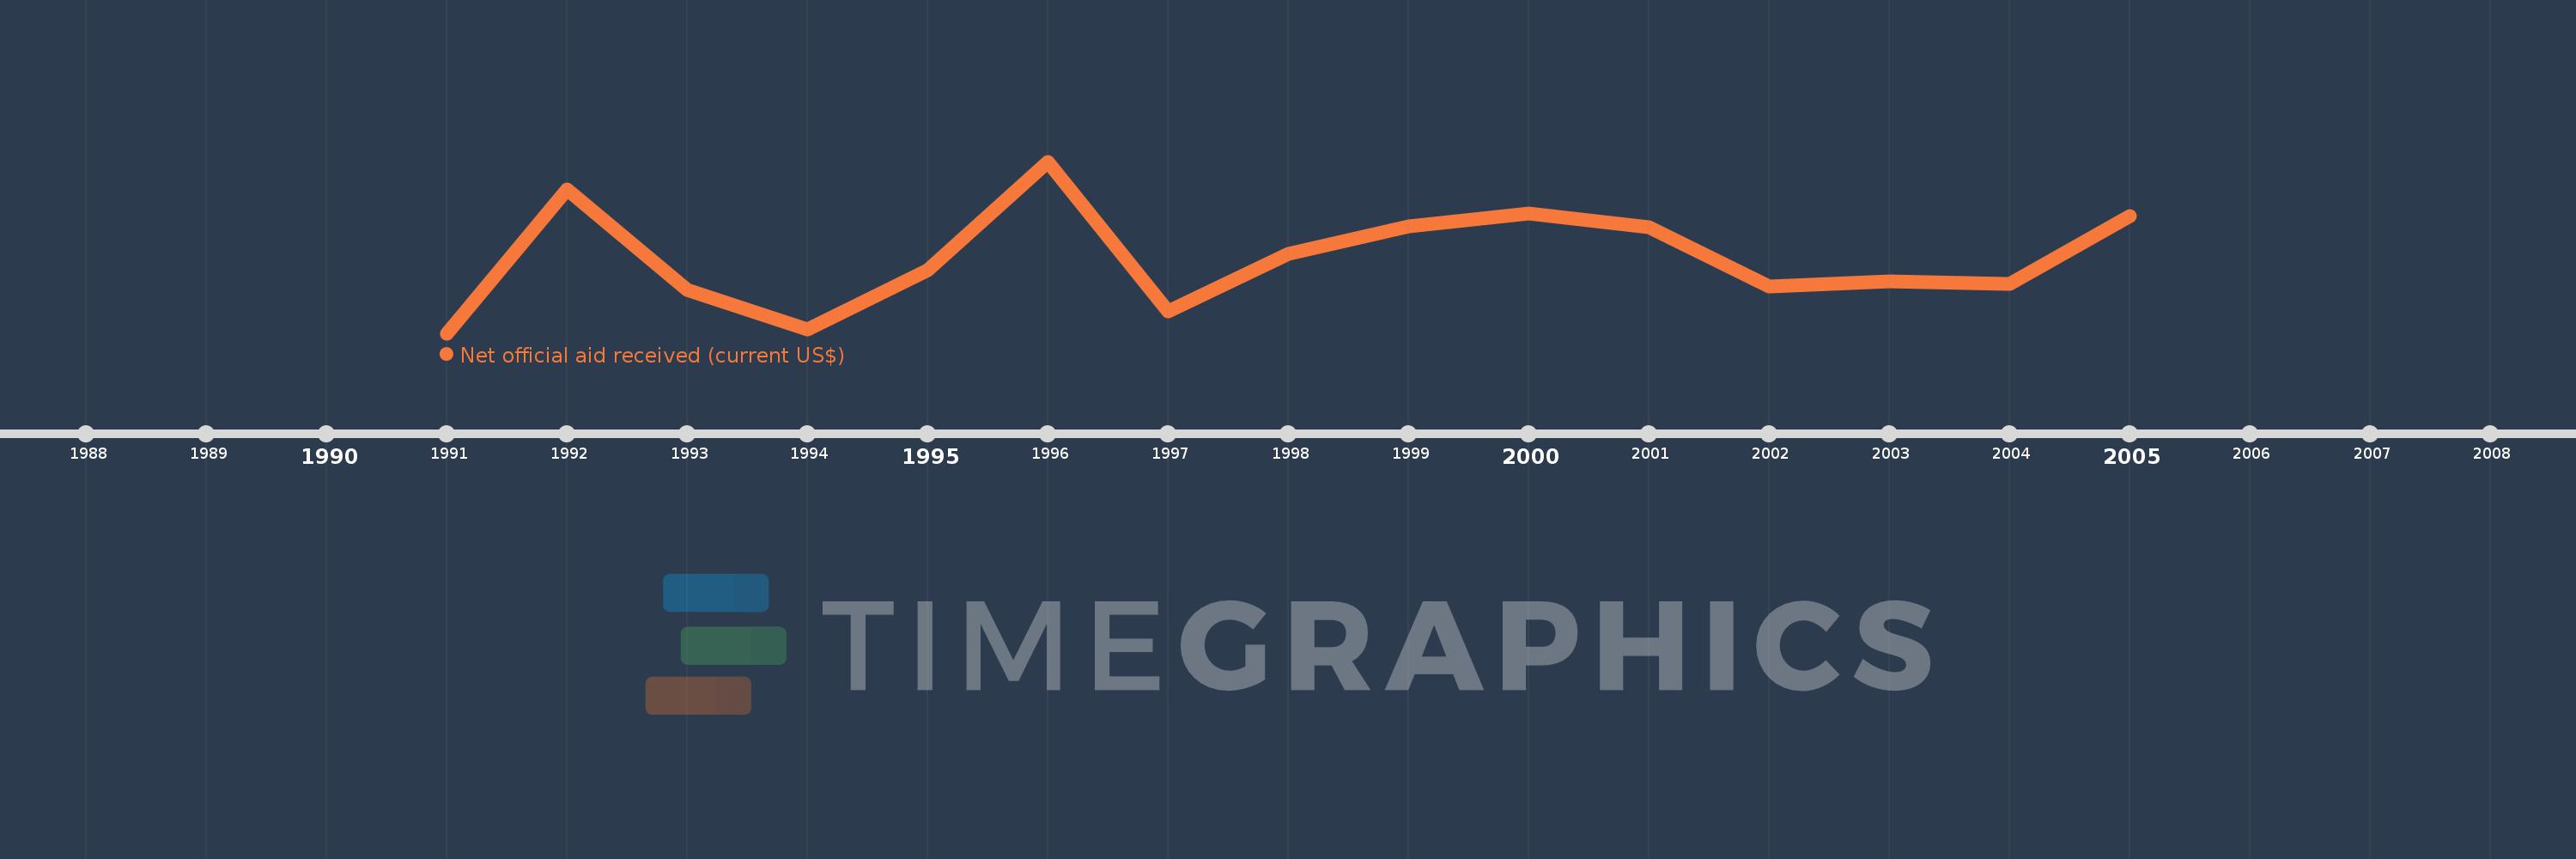
Net official aid received (current US$)
2005,2004,2003,2002,2001,2000,1999,1998,1997,1996,1995,1994,1993,1992,1991
This statistics in other country:
Timeline:
This timeline shows a graph from 1991 to 2005 of OECD members. No data until 1990. Number of actual observations by date: 15.
Source name:
World Development Indicators
Source organization:
Development Assistance Committee of the Organisation for Economic Co-operation and Development, Geographical Distribution of Financial Flows to Developing Countries, Development Co-operation Report, and International Development Statistics database. Data are available online at: www.oecd.org/dac/stats/idsonline.
Categories, topics:
Aid Effectiveness
Last updated:
apr 23, 2017
Indicators value changes by year
Minimum:
1.408 bln
jan 1, 1991
Maximum:
3.91 bln
jan 1, 1996
At the date of observation
Value
Absolute change
Change from previous value
jan 1, 1991
1.408 bln
+1.408 bln
0.0%
jan 1, 1992
3.498 bln
+2.09 bln
148.47%
jan 1, 1993
2.035 bln
-1.463 bln
-41.84%
jan 1, 1994
1.461 bln
-573.3 mln
-28.18%
jan 1, 1995
2.332 bln
+870.59 mln
59.58%
jan 1, 1996
3.91 bln
+1.579 bln
67.7%
jan 1, 1997
1.725 bln
-2.186 bln
-55.89%
jan 1, 1998
2.566 bln
+840.85 mln
48.75%
jan 1, 1999
2.972 bln
+406.02 mln
15.83%
jan 1, 2000
3.153 bln
+181.21 mln
6.1%
jan 1, 2001
2.952 bln
-200.67 mln
-6.36%
jan 1, 2002
2.096 bln
-856.3 mln
-29.01%
jan 1, 2003
2.163 bln
+66.63 mln
3.18%
jan 1, 2004
2.127 bln
-35.39 mln
-1.64%
jan 1, 2005
3.111 bln
+983.4 mln
46.23%
Ranking of countries by current statistics by years


Comments: