29
/
en
AIzaSyAYiBZKx7MnpbEhh9jyipgxe19OcubqV5w
April 1, 2024
45401
Low & middle income
LMY
false
2
1
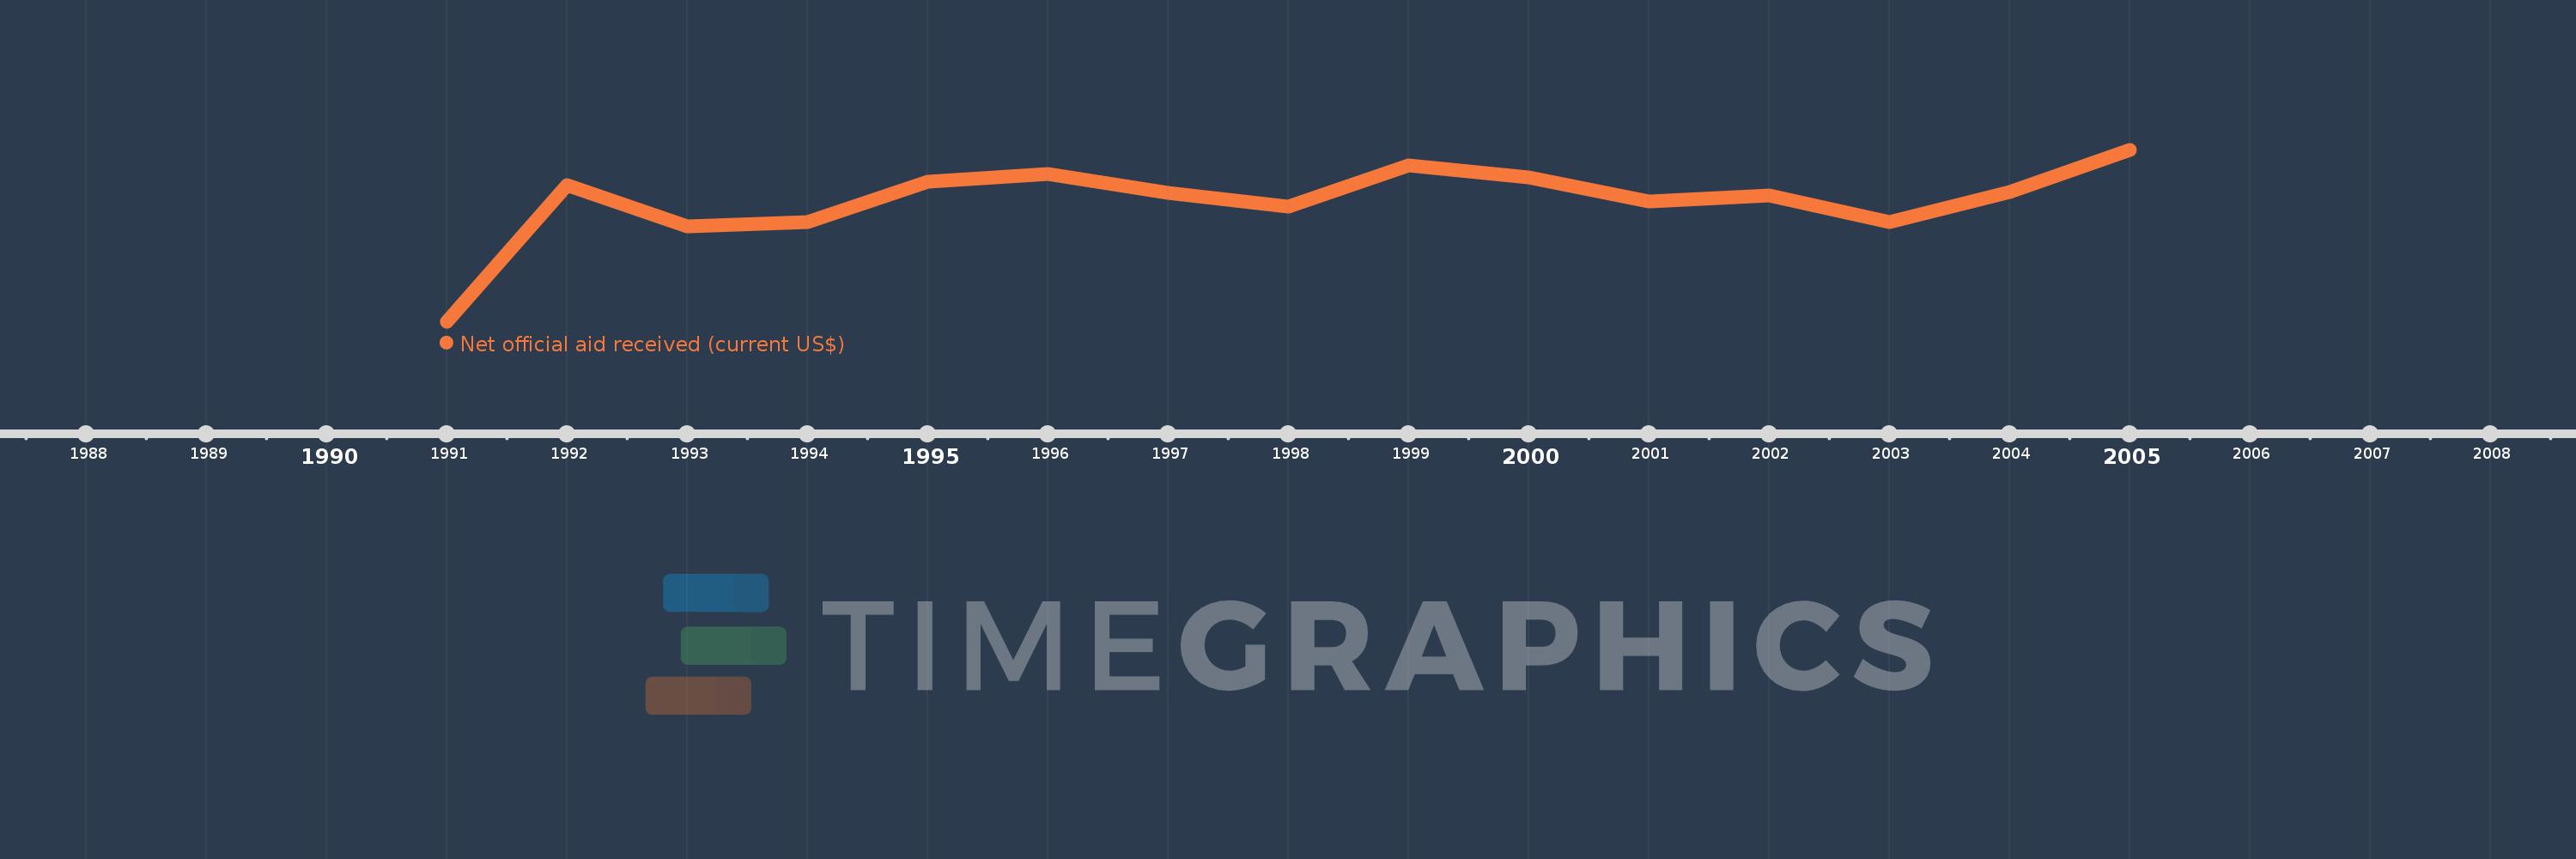
Net official aid received (current US$)
2005,2004,2003,2002,2001,2000,1999,1998,1997,1996,1995,1994,1993,1992,1991
This statistics in other country:
Timeline:
This timeline shows a graph from 1991 to 2005 of Low & middle income. No data until 1990. Number of actual observations by date: 15.
Source name:
World Development Indicators
Source organization:
Development Assistance Committee of the Organisation for Economic Co-operation and Development, Geographical Distribution of Financial Flows to Developing Countries, Development Co-operation Report, and International Development Statistics database. Data are available online at: www.oecd.org/dac/stats/idsonline.
Categories, topics:
Aid Effectiveness
Last updated:
apr 23, 2017
Indicators value changes by year
Minimum:
625.74 mln
jan 1, 1991
Maximum:
3.07 bln
jan 1, 2005
At the date of observation
Value
Absolute change
Change from previous value
jan 1, 1991
625.74 mln
+625.74 mln
0.0%
jan 1, 1992
2.578 bln
+1.953 bln
312.06%
jan 1, 1993
1.984 bln
-594.05 mln
-23.04%
jan 1, 1994
2.047 bln
+62.14 mln
3.13%
jan 1, 1995
2.623 bln
+576.34 mln
28.16%
jan 1, 1996
2.734 bln
+111.46 mln
4.25%
jan 1, 1997
2.459 bln
-275.33 mln
-10.07%
jan 1, 1998
2.271 bln
-187.59 mln
-7.63%
jan 1, 1999
2.849 bln
+577.55 mln
25.43%
jan 1, 2000
2.682 bln
-167.24 mln
-5.87%
jan 1, 2001
2.346 bln
-335.82 mln
-12.52%
jan 1, 2002
2.43 bln
+84.49 mln
3.6%
jan 1, 2003
2.05 bln
-380.58 mln
-15.66%
jan 1, 2004
2.47 bln
+420.18 mln
20.5%
jan 1, 2005
3.07 bln
+600.47 mln
24.31%
Ranking of countries by current statistics by years


Comments: