29
/
en
AIzaSyAYiBZKx7MnpbEhh9jyipgxe19OcubqV5w
April 1, 2024
75374
Azerbaijan
AZE
true
2
1
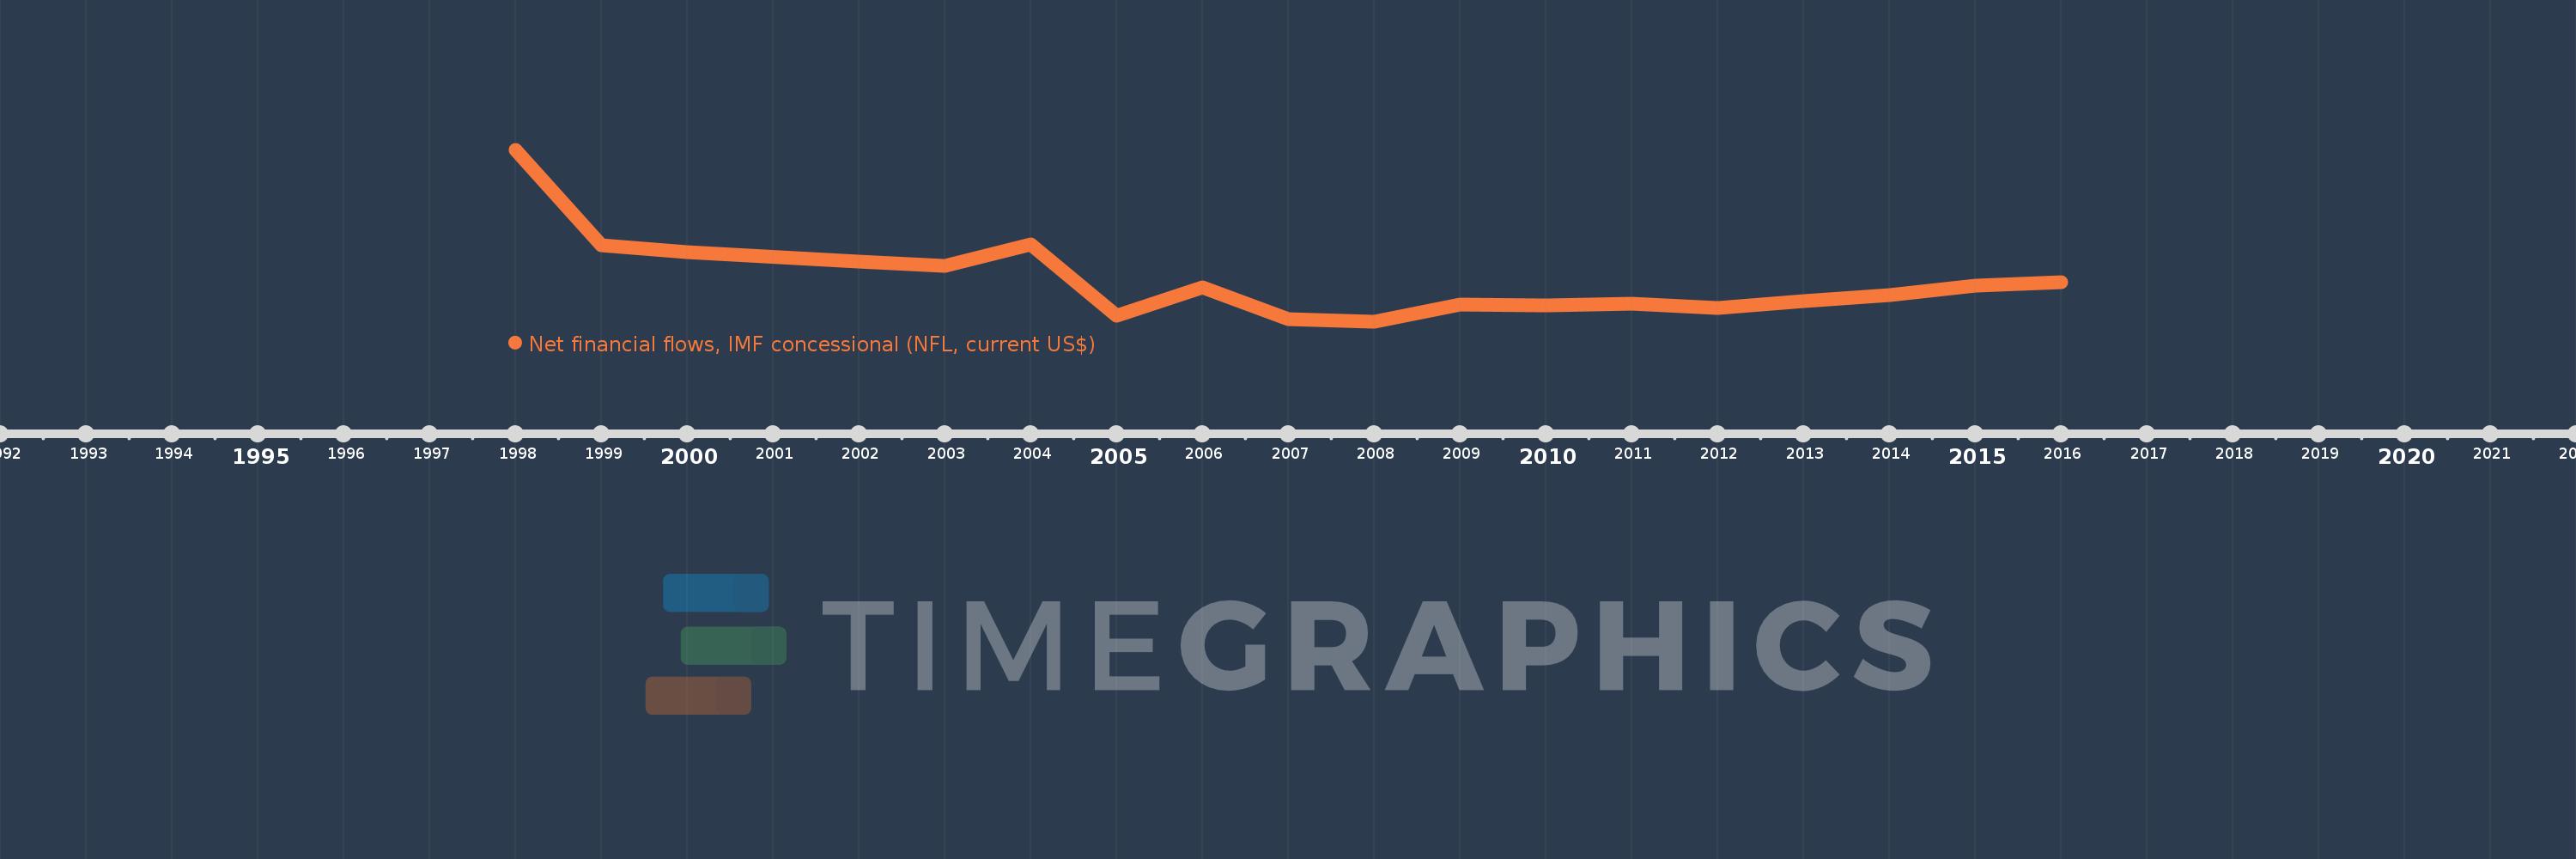
Net financial flows, IMF concessional (NFL, current US$)
2016,2015,2014,2013,2012,2011,2010,2009,2008,2007,2006,2005,2004,2003,2002,2000,1999,1998
This statistics in other country:
Timeline:
This timeline shows a graph from 1998 to 2016 of Azerbaijan. No data until 1997. Number of actual observations by date: 18.
Source name:
World Development Indicators
Source organization:
World Bank, International Debt Statistics.
Categories, topics:
External Debt
Last updated:
apr 23, 2017
Indicators value changes by year
Minimum:
-25.638 mln
jan 1, 2008
Maximum:
76.483 mln
jan 1, 1998
At the date of observation
Value
Absolute change
Change from previous value
jan 1, 1998
76.483 mln
+76.483 mln
0.0%
jan 1, 1999
19.836 mln
-56.647 mln
-74.06%
jan 1, 2000
15.998 mln
-3.838 mln
-19.35%
jan 1, 2002
10.248 mln
-5.75 mln
-35.94%
jan 1, 2003
7.772 mln
-2.476 mln
-24.16%
jan 1, 2004
20.456 mln
+12.684 mln
163.2%
jan 1, 2005
-21.674 mln
-42.13 mln
-205.95%
jan 1, 2006
-5.186 mln
+16.488 mln
-76.07%
jan 1, 2007
-24.102 mln
-18.916 mln
364.75%
jan 1, 2008
-25.638 mln
-1.536 mln
6.37%
jan 1, 2009
-15.446 mln
+10.192 mln
-39.75%
jan 1, 2010
-15.615 mln
-169.0K
1.09%
jan 1, 2011
-14.733 mln
+882.0K
-5.65%
jan 1, 2012
-17.253 mln
-2.52 mln
17.1%
jan 1, 2013
-13.026 mln
+4.227 mln
-24.5%
jan 1, 2014
-9.817 mln
+3.209 mln
-24.64%
jan 1, 2015
-3.911 mln
+5.906 mln
-60.16%
jan 1, 2016
-1.801 mln
+2.11 mln
-53.95%
Ranking of countries by current statistics by years


Comments: