29
/
en
AIzaSyAYiBZKx7MnpbEhh9jyipgxe19OcubqV5w
April 1, 2024
201946
Morocco
MAR
true
2
1
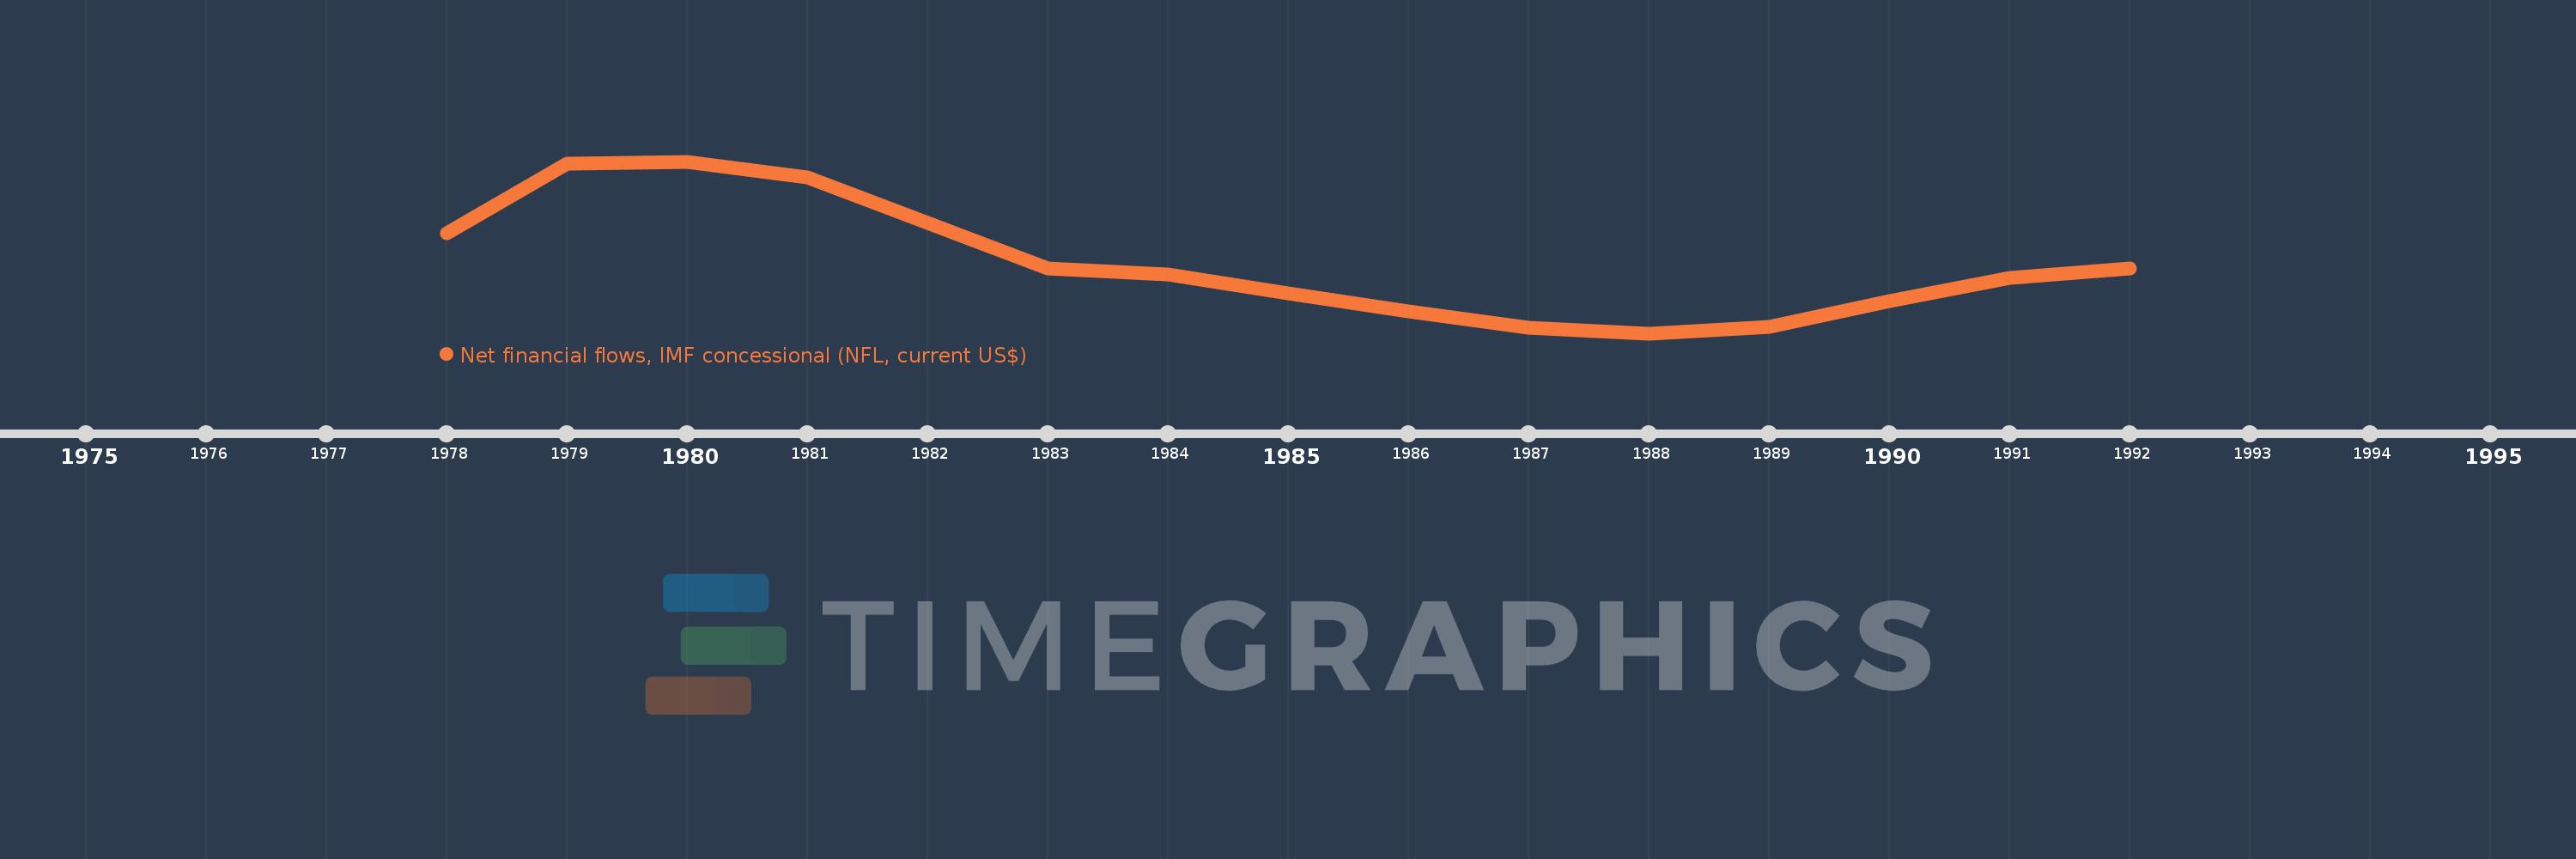
Net financial flows, IMF concessional (NFL, current US$)
1992,1991,1990,1989,1988,1987,1986,1985,1984,1983,1981,1980,1979,1978
This statistics in other country:
Timeline:
This timeline shows a graph from 1978 to 1992 of Morocco. No data until 1977. Number of actual observations by date: 14.
Source name:
World Development Indicators
Source organization:
World Bank, International Debt Statistics.
Categories, topics:
External Debt
Last updated:
apr 23, 2017
Indicators value changes by year
Minimum:
-28.033 mln
jan 1, 1988
Maximum:
44.239 mln
jan 1, 1980
At the date of observation
Value
Absolute change
Change from previous value
jan 1, 1978
14.117 mln
+14.117 mln
0.0%
jan 1, 1979
43.514 mln
+29.397 mln
208.24%
jan 1, 1980
44.239 mln
+725.0K
1.67%
jan 1, 1981
37.652 mln
-6.587 mln
-14.89%
jan 1, 1983
-661.0K
-38.313 mln
-101.76%
jan 1, 1984
-3.383 mln
-2.722 mln
411.8%
jan 1, 1985
-11.081 mln
-7.698 mln
227.55%
jan 1, 1986
-18.861 mln
-7.78 mln
70.21%
jan 1, 1987
-25.816 mln
-6.955 mln
36.88%
jan 1, 1988
-28.033 mln
-2.217 mln
8.59%
jan 1, 1989
-25.32 mln
+2.713 mln
-9.68%
jan 1, 1990
-14.341 mln
+10.979 mln
-43.36%
jan 1, 1991
-4.664 mln
+9.677 mln
-67.48%
jan 1, 1992
-584.0K
+4.08 mln
-87.48%
Ranking of countries by current statistics by years


Comments: