29
/
en
AIzaSyAYiBZKx7MnpbEhh9jyipgxe19OcubqV5w
April 1, 2024
138397
Georgia
GEO
true
2
1
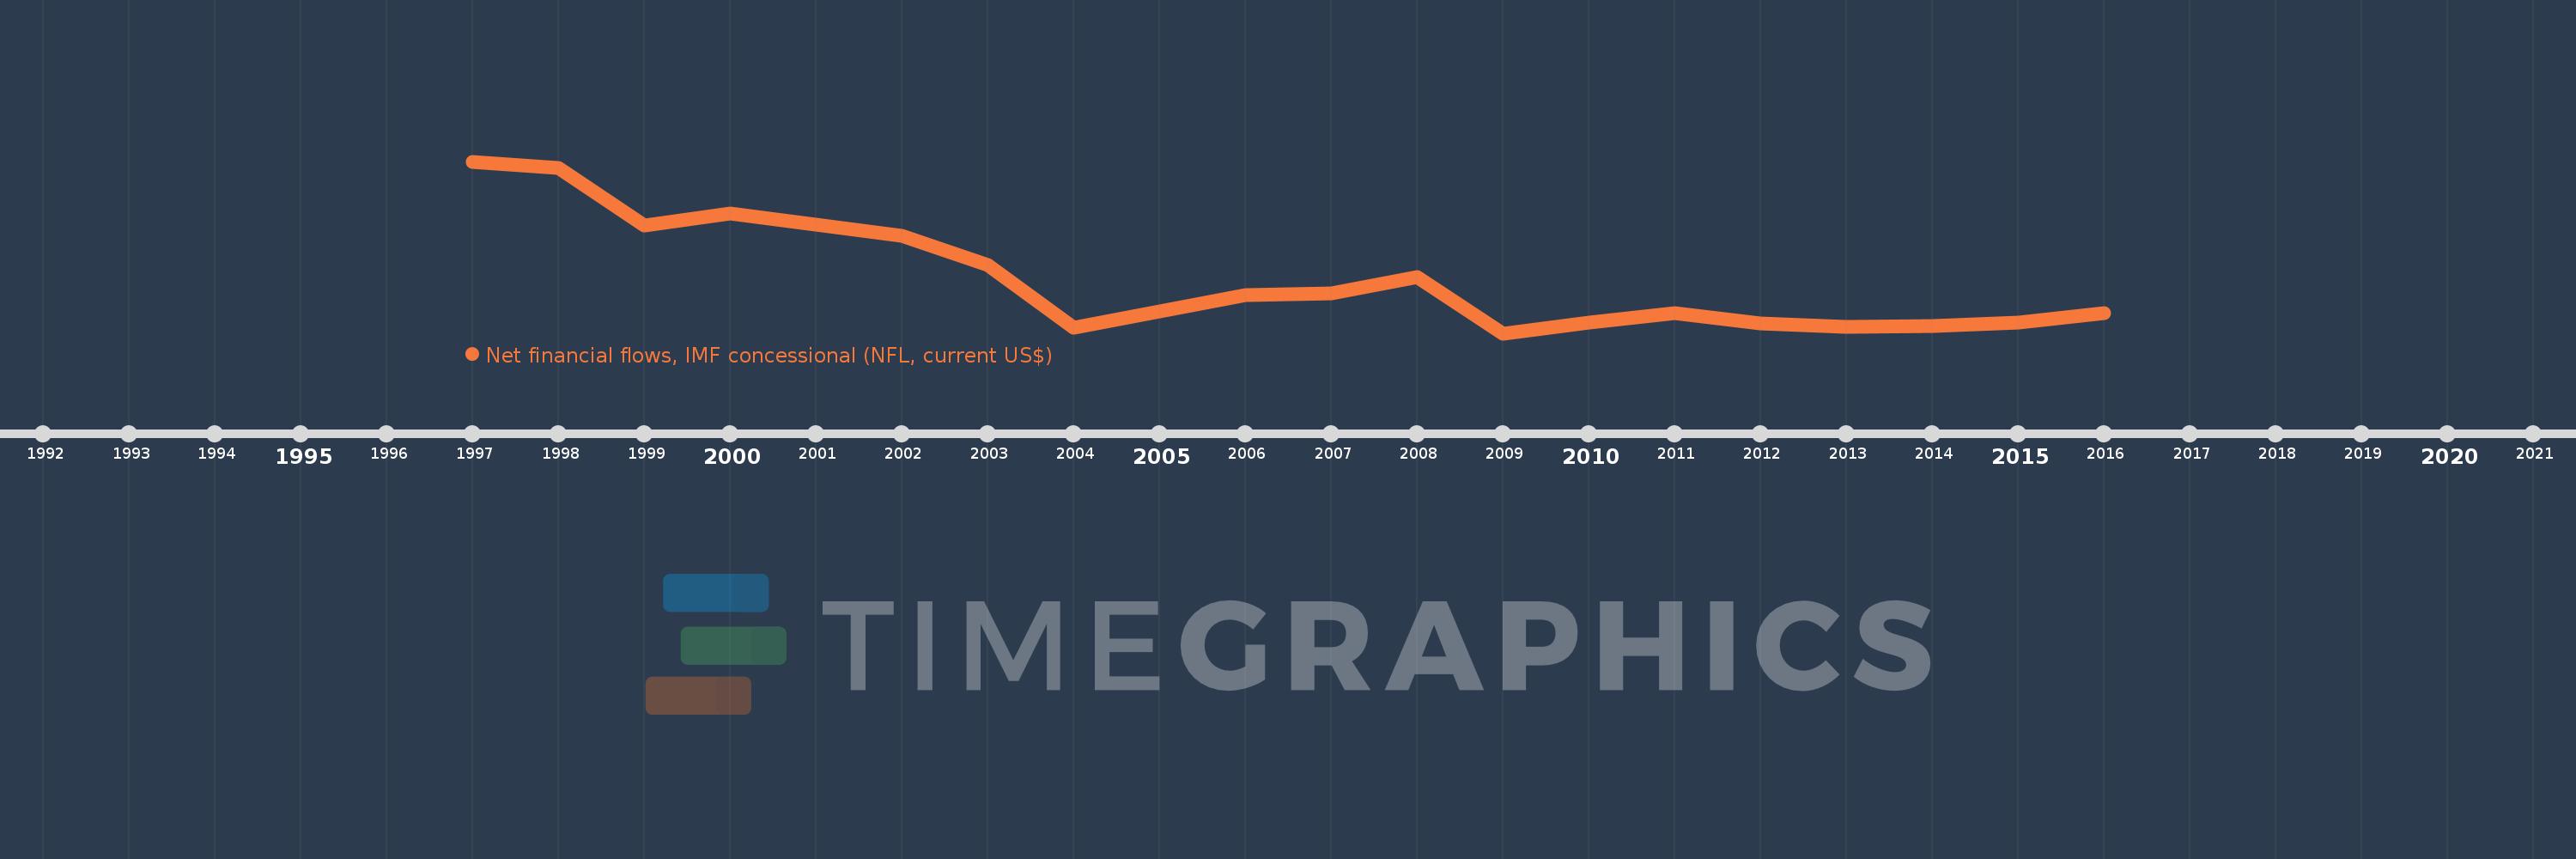
Net financial flows, IMF concessional (NFL, current US$)
2016,2015,2014,2013,2012,2011,2010,2009,2008,2007,2006,2005,2004,2003,2002,2000,1999,1998,1997
This statistics in other country:
Timeline:
This timeline shows a graph from 1997 to 2016 of Georgia. No data until 1996. Number of actual observations by date: 19.
Source name:
World Development Indicators
Source organization:
World Bank, International Debt Statistics.
Categories, topics:
External Debt
Last updated:
apr 23, 2017
Indicators value changes by year
Minimum:
-34.951 mln
jan 1, 2009
Maximum:
80.574 mln
jan 1, 1997
At the date of observation
Value
Absolute change
Change from previous value
jan 1, 1997
80.574 mln
+80.574 mln
0.0%
jan 1, 1998
76.373 mln
-4.201 mln
-5.21%
jan 1, 1999
37.651 mln
-38.722 mln
-50.7%
jan 1, 2000
45.534 mln
+7.883 mln
20.94%
jan 1, 2002
30.84 mln
-14.694 mln
-32.27%
jan 1, 2003
11.169 mln
-19.671 mln
-63.78%
jan 1, 2004
-31.053 mln
-42.222 mln
-378.03%
jan 1, 2005
-20.378 mln
+10.675 mln
-34.38%
jan 1, 2006
-9.469 mln
+10.909 mln
-53.53%
jan 1, 2007
-7.998 mln
+1.471 mln
-15.53%
jan 1, 2008
3.161 mln
+11.159 mln
-139.52%
jan 1, 2009
-34.951 mln
-38.112 mln
-1.21K%
jan 1, 2010
-27.703 mln
+7.248 mln
-20.74%
jan 1, 2011
-21.516 mln
+6.187 mln
-22.33%
jan 1, 2012
-28.224 mln
-6.708 mln
31.18%
jan 1, 2013
-30.399 mln
-2.175 mln
7.71%
jan 1, 2014
-29.9 mln
+499.0K
-1.64%
jan 1, 2015
-27.652 mln
+2.248 mln
-7.52%
jan 1, 2016
-21.547 mln
+6.105 mln
-22.08%
Ranking of countries by current statistics by years


Comments: