29
/
en
AIzaSyAYiBZKx7MnpbEhh9jyipgxe19OcubqV5w
April 1, 2024
252197
St. Vincent and the Grenadines
VCT
true
2
1
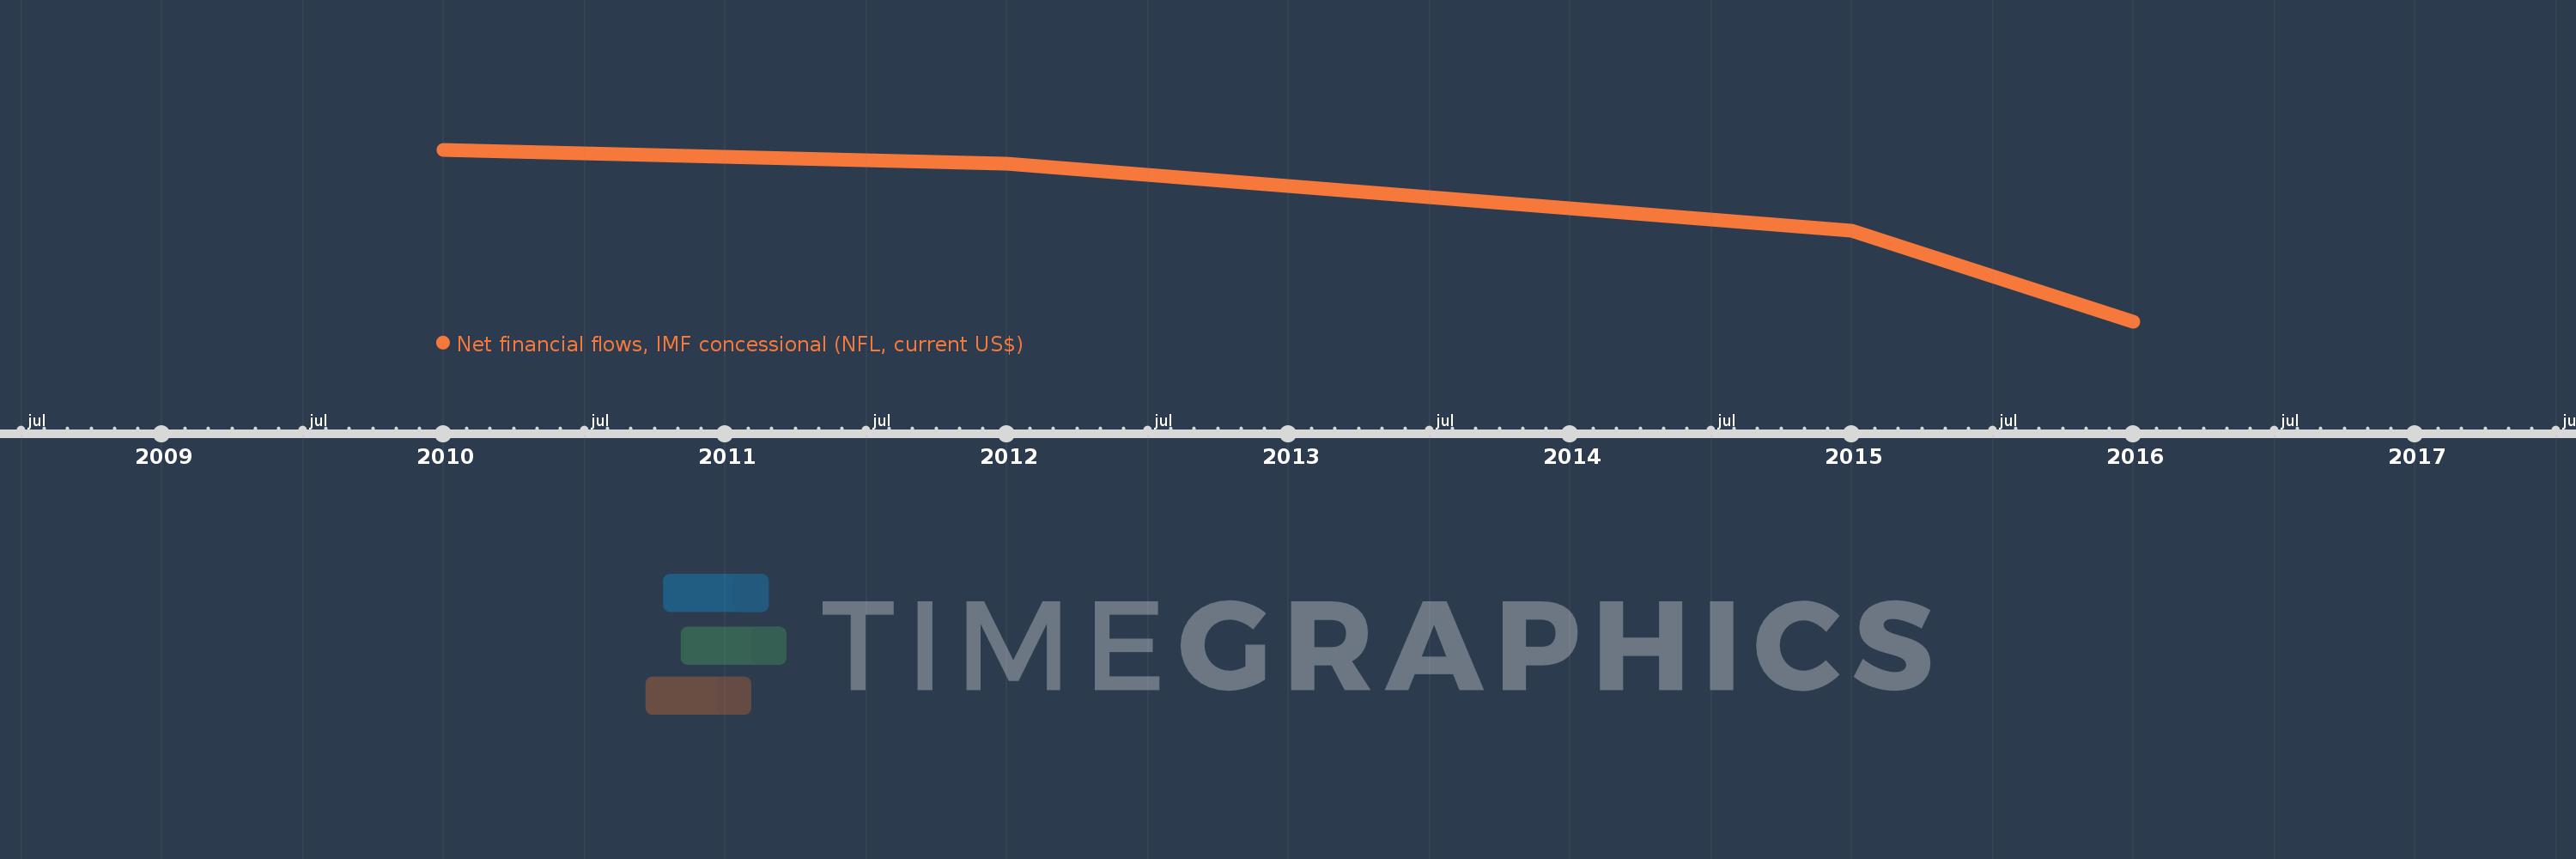
Net financial flows, IMF concessional (NFL, current US$)
2016,2015,2012,2010
This statistics in other country:
Timeline:
This timeline shows a graph from 2010 to 2016 of St. Vincent and the Grenadines. No data until 2009. Number of actual observations by date: 4.
Source name:
World Development Indicators
Source organization:
World Bank, International Debt Statistics.
Categories, topics:
External Debt
Last updated:
apr 23, 2017
Indicators value changes by year
Minimum:
-1.045 mln
jan 1, 2016
Maximum:
5.761 mln
jan 1, 2010
At the date of observation
Value
Absolute change
Change from previous value
jan 1, 2010
5.761 mln
+5.761 mln
0.0%
jan 1, 2012
5.235 mln
-526.0K
-9.13%
jan 1, 2015
2.585 mln
-2.65 mln
-50.62%
jan 1, 2016
-1.045 mln
-3.63 mln
-140.43%
Ranking of countries by current statistics by years


Comments: