29
/
en
AIzaSyAYiBZKx7MnpbEhh9jyipgxe19OcubqV5w
April 1, 2024
287573
Zimbabwe
ZWE
true
2
1
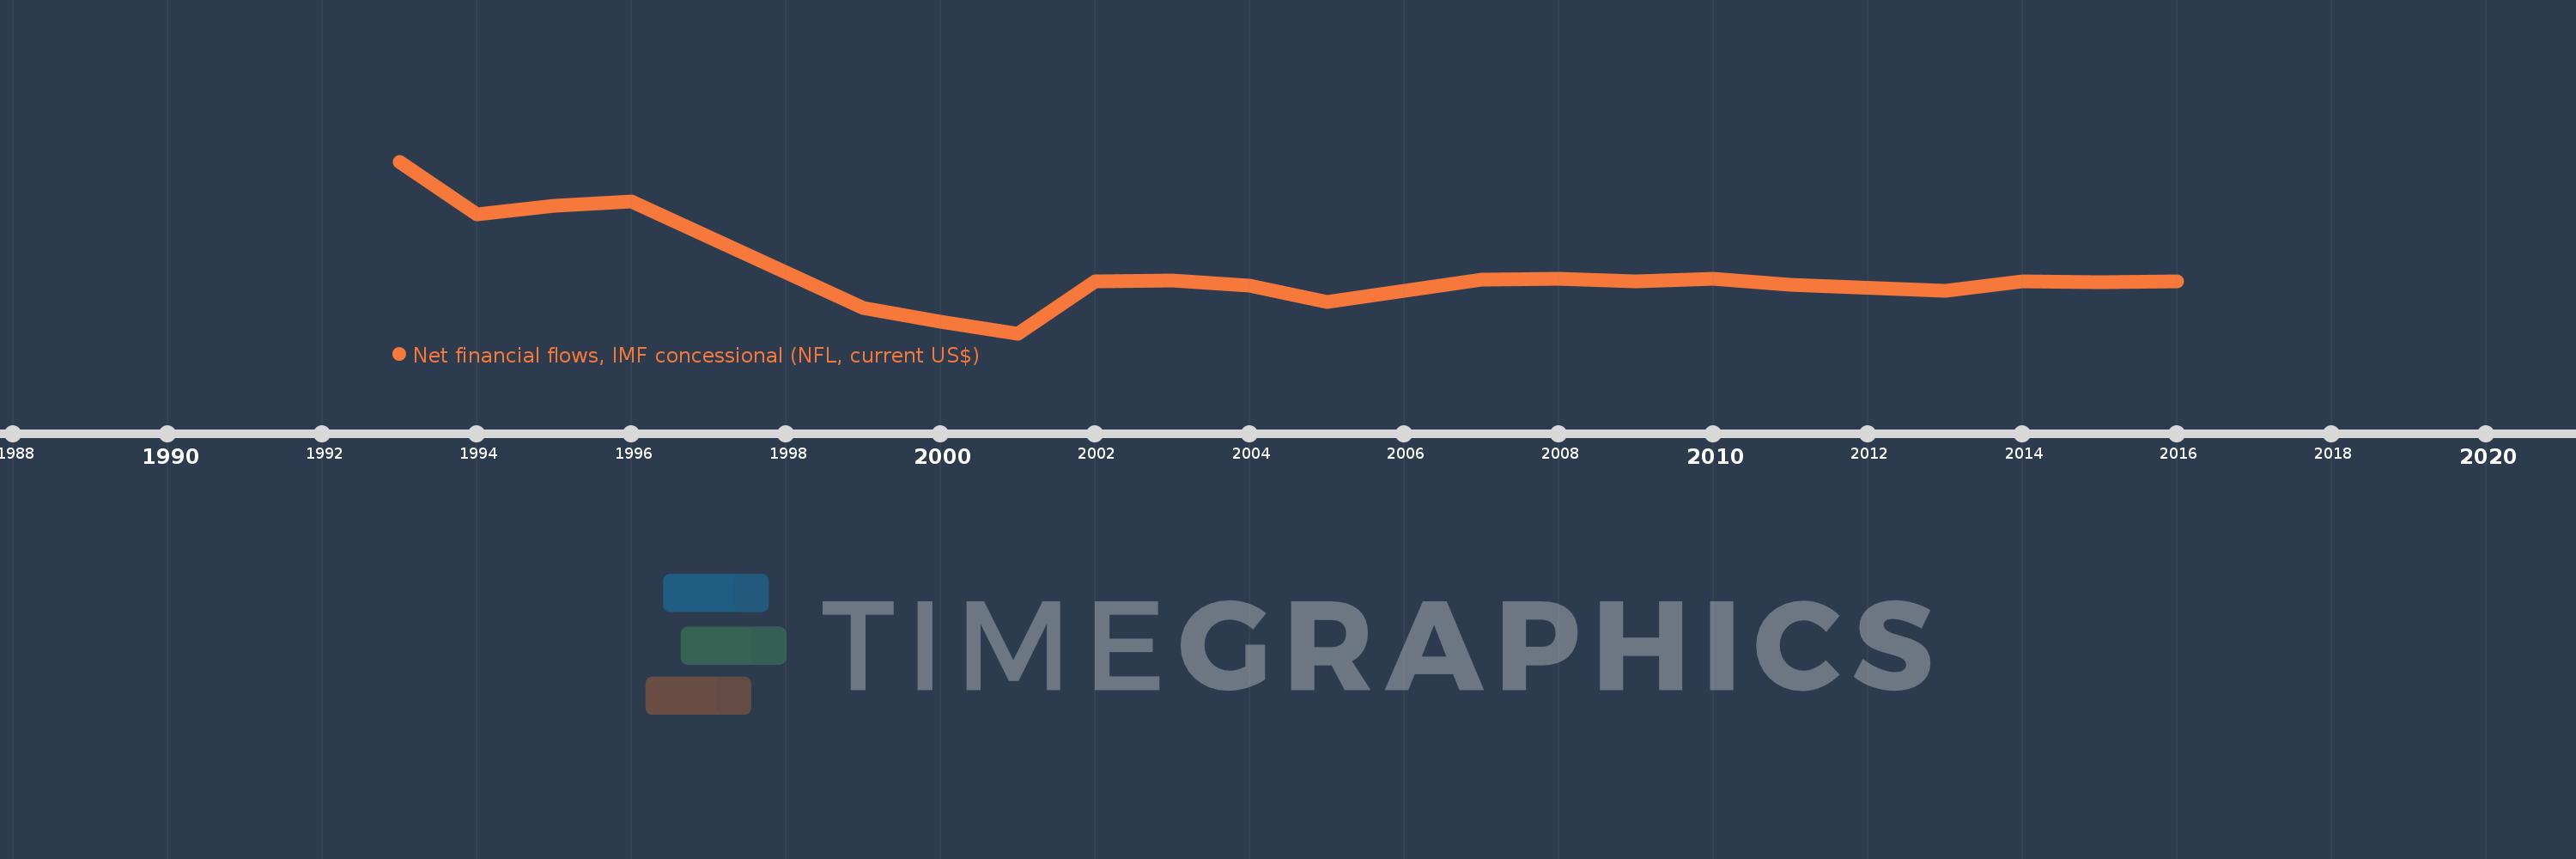
Net financial flows, IMF concessional (NFL, current US$)
2016,2015,2014,2013,2011,2010,2009,2008,2007,2005,2004,2003,2002,2001,2000,1999,1996,1995,1994,1993
This statistics in other country:
Timeline:
This timeline shows a graph from 1993 to 2016 of Zimbabwe. No data until 1992. Number of actual observations by date: 20.
Source name:
World Development Indicators
Source organization:
World Bank, International Debt Statistics.
Categories, topics:
External Debt
Last updated:
apr 23, 2017
Indicators value changes by year
Minimum:
-35.666 mln
jan 1, 2001
Maximum:
77.051 mln
jan 1, 1993
At the date of observation
Value
Absolute change
Change from previous value
jan 1, 1993
77.051 mln
+77.051 mln
0.0%
jan 1, 1994
42.45 mln
-34.601 mln
-44.91%
jan 1, 1995
47.831 mln
+5.381 mln
12.68%
jan 1, 1996
50.676 mln
+2.845 mln
5.95%
jan 1, 1999
-18.968 mln
-69.644 mln
-137.43%
jan 1, 2000
-27.84 mln
-8.872 mln
46.77%
jan 1, 2001
-35.666 mln
-7.826 mln
28.11%
jan 1, 2002
-1.319 mln
+34.347 mln
-96.3%
jan 1, 2003
-1.103 mln
+216.0K
-16.38%
jan 1, 2004
-4.48 mln
-3.377 mln
306.17%
jan 1, 2005
-15.108 mln
-10.628 mln
237.23%
jan 1, 2007
-396.0K
+14.712 mln
-97.38%
jan 1, 2008
-118.0K
+278.0K
-70.2%
jan 1, 2009
-1.676 mln
-1.558 mln
1.32K%
jan 1, 2010
-113.0K
+1.563 mln
-93.26%
jan 1, 2011
-3.983 mln
-3.87 mln
3.42K%
jan 1, 2013
-7.491 mln
-3.508 mln
88.07%
jan 1, 2014
-1.808 mln
+5.683 mln
-75.86%
jan 1, 2015
-1.951 mln
-143.0K
7.91%
jan 1, 2016
-1.802 mln
+149.0K
-7.64%
Ranking of countries by current statistics by years


Comments: