30
/
AIzaSyAYiBZKx7MnpbEhh9jyipgxe19OcubqV5w
April 1, 2024
65090
Albania
ALB
true
2
1
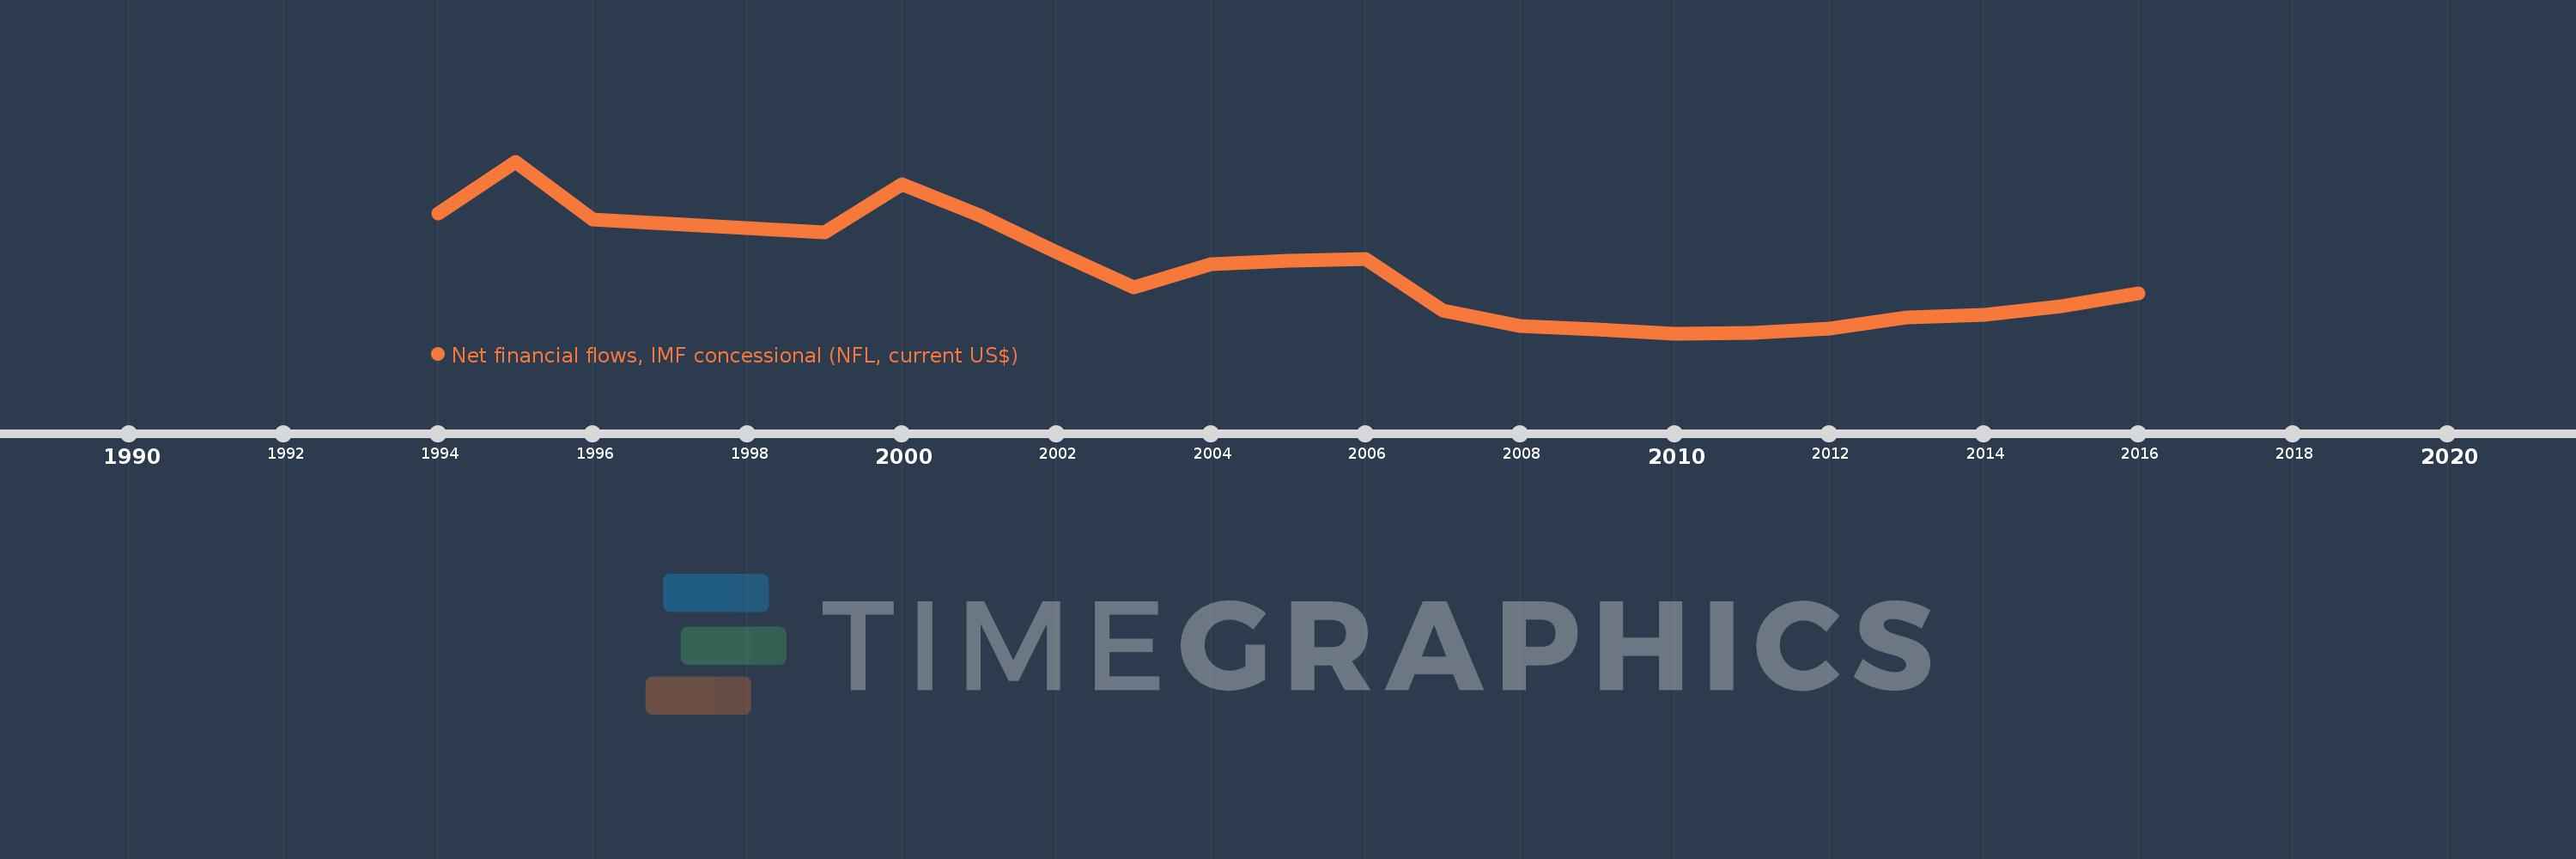
Net financial flows, IMF concessional (NFL, current US$)
2016,2015,2014,2013,2012,2011,2010,2009,2008,2007,2006,2005,2004,2003,2002,2001,2000,1999,1996,1995,1994
Public Timelines
FAQ
Menu
Public Timelines
FAQ
For education
For educational institutions
For teachers
For students
Open cabinet
Create
Close
Create a timeline
Public timelines
Library
FAQ
Download
Global statistics library
→
Albania
→
Net financial flows, IMF concessional (NFL, current US$)
This statistics in other country:
Afghanistan
Albania
Armenia
Azerbaijan
Bangladesh
Benin
Bolivia
Burkina Faso
Burundi
Cabo Verde
Cambodia
Cameroon
Central African Republic
Chad
Chile
China
Comoros
Congo, Dem. Rep.
Congo, Rep.
Cote d'Ivoire
Djibouti
Dominica
East Asia & Pacific (excluding high income)
Egypt, Arab Rep.
Ethiopia
Europe & Central Asia (excluding high income)
Gambia, The
Georgia
Ghana
Grenada
Guinea
Guinea-Bissau
Guyana
Haiti
Honduras
Hungary
IDA only
India
Kenya
Kyrgyz Republic
Lao PDR
Latin America & Caribbean (excluding high income)
Latvia
Lesotho
Liberia
Lithuania
Low & middle income
Low income
Lower middle income
Macedonia, FYR
Madagascar
Malawi
Maldives
Mali
Mauritania
Mauritius
Middle East & North Africa (excluding high income)
Middle income
Moldova
Mongolia
Morocco
Mozambique
Nepal
Nicaragua
Niger
Pakistan
Papua New Guinea
Philippines
Rwanda
Samoa
Sao Tome and Principe
Senegal
Seychelles
Sierra Leone
Solomon Islands
Somalia
South Asia
Sri Lanka
St. Lucia
St. Vincent and the Grenadines
Sub-Saharan Africa (excluding high income)
Sudan
Swaziland
Syrian Arab Republic
Tajikistan
Tanzania
Thailand
Togo
Tunisia
Uganda
Upper middle income
Uruguay
Vanuatu
Vietnam
Yemen, Rep.
Zambia
Zimbabwe
Timeline:
This timeline shows a graph from
1994
to
2016
of Albania. No data until
1993
. Number of actual observations by date:
21
.
Source name:
World Development Indicators
Source organization:
World Bank, International Debt Statistics.
Categories, topics:
External Debt
Last updated:
apr 23, 2017
Indicators value changes by year
Meaning:
-149.333K
Minimum:
-12.134 mln
jan 1, 2010
Maximum:
22.24 mln
jan 1, 1995
At the date of observation
Value
Absolute change
Change from the previous value
jan 1, 1994
11.827 mln
+11.827 mln
0.0%
jan 1, 1995
22.24 mln
+10.413 mln
88.04%
jan 1, 1996
10.712 mln
-11.528 mln
-51.83%
jan 1, 1999
7.985 mln
-2.727 mln
-25.46%
jan 1, 2000
17.669 mln
+9.684 mln
121.28%
jan 1, 2001
11.576 mln
-6.093 mln
-34.48%
jan 1, 2002
4.072 mln
-7.504 mln
-64.82%
jan 1, 2003
-2.865 mln
-6.937 mln
-170.36%
jan 1, 2004
1.677 mln
+4.542 mln
-158.53%
jan 1, 2005
2.38 mln
+703.0K
41.92%
jan 1, 2006
2.705 mln
+325.0K
13.66%
jan 1, 2007
-7.595 mln
-10.3 mln
-380.78%
jan 1, 2008
-10.675 mln
-3.08 mln
40.55%
jan 1, 2009
-11.358 mln
-683.0K
6.4%
jan 1, 2010
-12.134 mln
-776.0K
6.83%
jan 1, 2011
-12.124 mln
+10.0K
-0.08%
jan 1, 2012
-11.247 mln
+877.0K
-7.23%
jan 1, 2013
-8.874 mln
+2.373 mln
-21.1%
jan 1, 2014
-8.384 mln
+490.0K
-5.52%
jan 1, 2015
-6.659 mln
+1.725 mln
-20.57%
jan 1, 2016
-4.064 mln
+2.595 mln
-38.97%
Ranking of countries by current statistics by years
About & Feedback
Terms
Privacy
Library
2024
©
Time.Graphics
Support 24/7
Cabinet
Get premium
Donate
The service accepts bank transfer (ACH, Wire) or cards (Visa, MasterCard, etc). Processed by Stripe.
Secured with SSL
Excellent (Trustpilot Reviews)
Based on 115+ reviews
Write your own review on
Trustpilot.com
