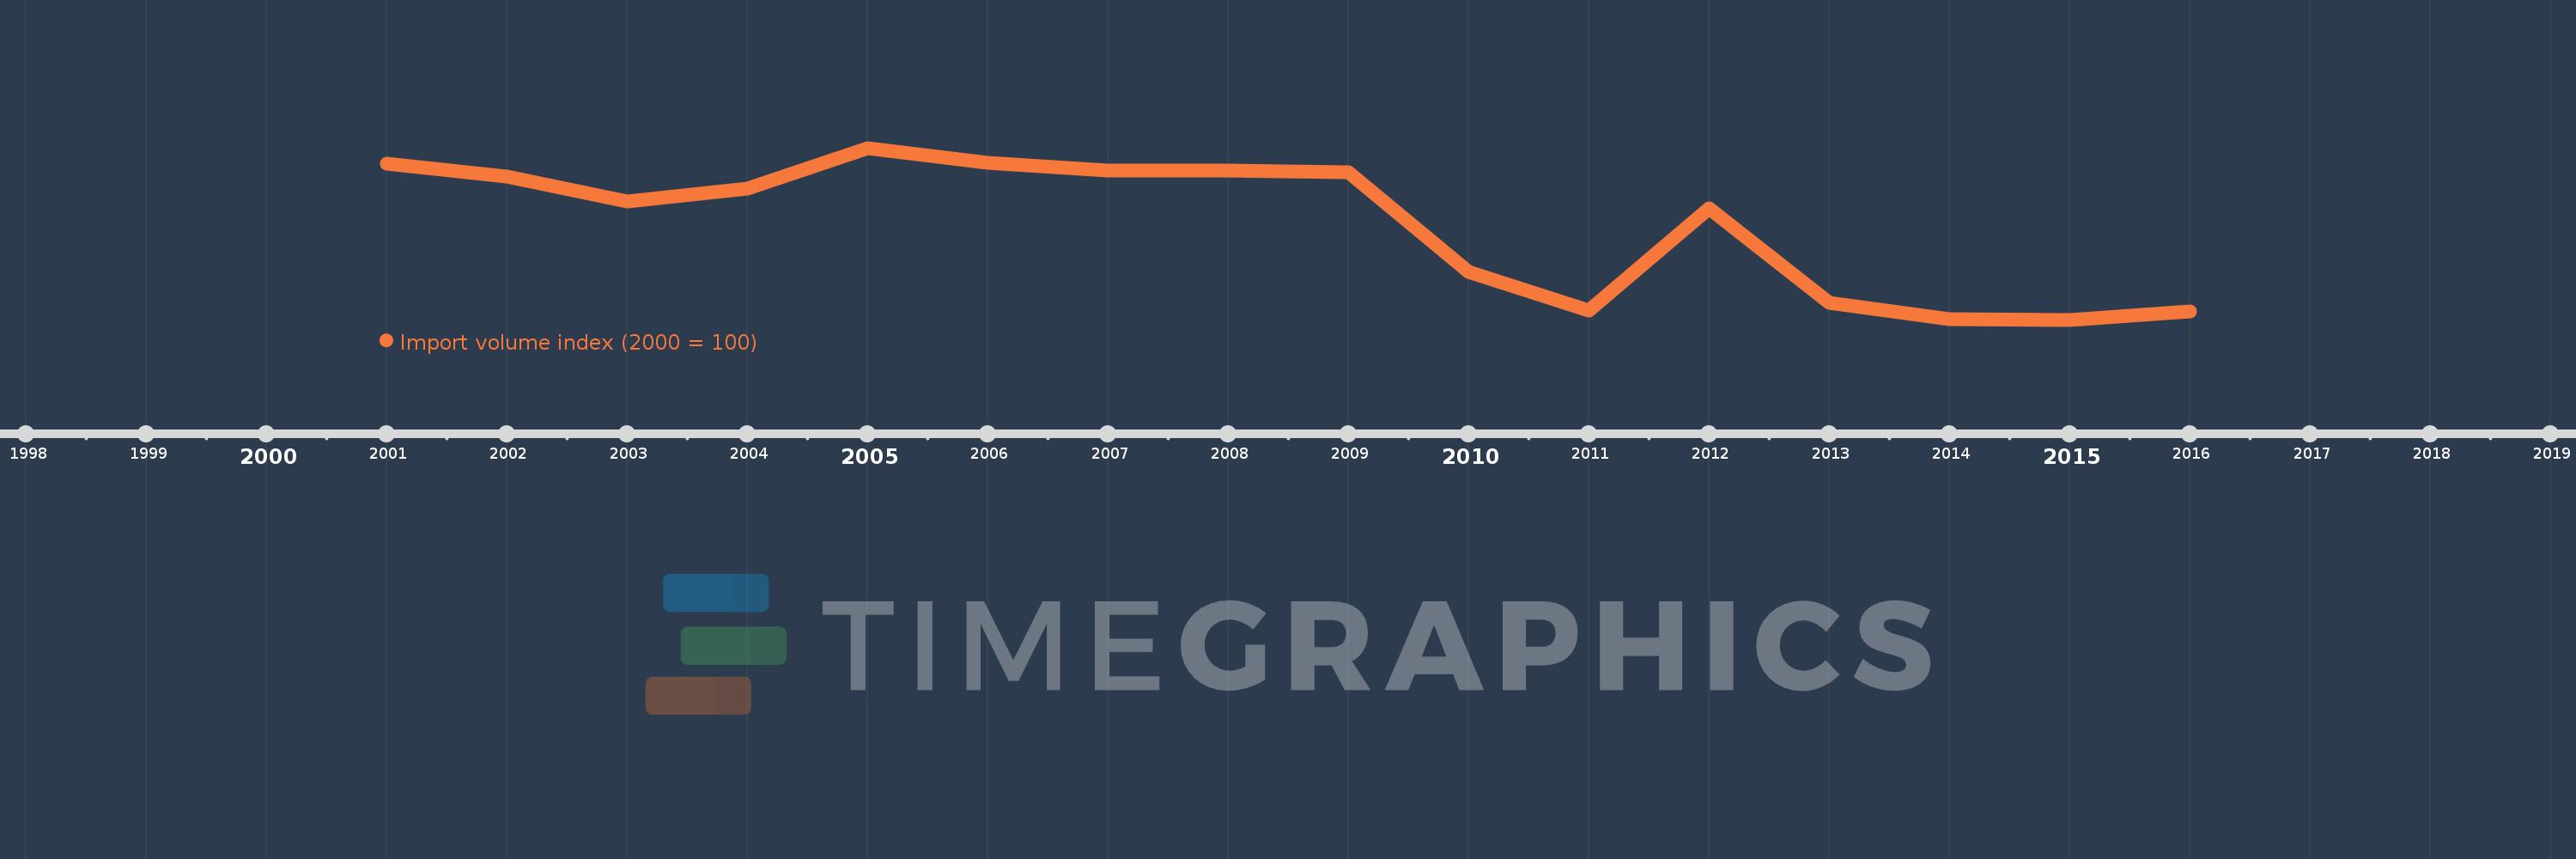
This timeline shows a graph from 2001 to 2016 of Aruba. No data until 2000. Number of actual observations by date: 16.
Source name:
World Development Indicators
Source organization:
United Nations Conference on Trade and Development, Handbook of Statistics and data files, and International Monetary Fund, International Financial Statistics.
Categories, topics:
Private Sector, Trade
Last updated:
apr 23, 2017
Indicators value changes by year
Meaning:
67.577
Minimum:
17.488
jan 1, 2015
Maximum:
108.285
jan 1, 2005
At the date of observation
Value
Absolute change
Change from the previous value
jan 1, 2001
100.0
+100.0
0.0%
jan 1, 2002
93.134
-6.866
-6.87%
jan 1, 2003
79.943
-13.191
-14.16%
jan 1, 2004
86.787
+6.844
8.56%
jan 1, 2005
108.285
+21.498
24.77%
jan 1, 2006
100.345
-7.939
-7.33%
jan 1, 2007
96.417
-3.929
-3.92%
jan 1, 2008
96.148
-0.269
-0.28%
jan 1, 2009
95.518
-0.63
-0.66%
jan 1, 2010
42.734
-52.784
-55.26%
jan 1, 2011
22.165
-20.569
-48.13%
jan 1, 2012
76.377
+54.212
244.59%
jan 1, 2013
26.325
-50.052
-65.53%
jan 1, 2014
17.873
-8.452
-32.11%
jan 1, 2015
17.488
-0.385
-2.15%
jan 1, 2016
21.694
+4.205
24.05%
Ranking of countries by current statistics by years
