29
/
en
AIzaSyAYiBZKx7MnpbEhh9jyipgxe19OcubqV5w
April 1, 2024
111058
Congo, Rep.
COG
true
2
1
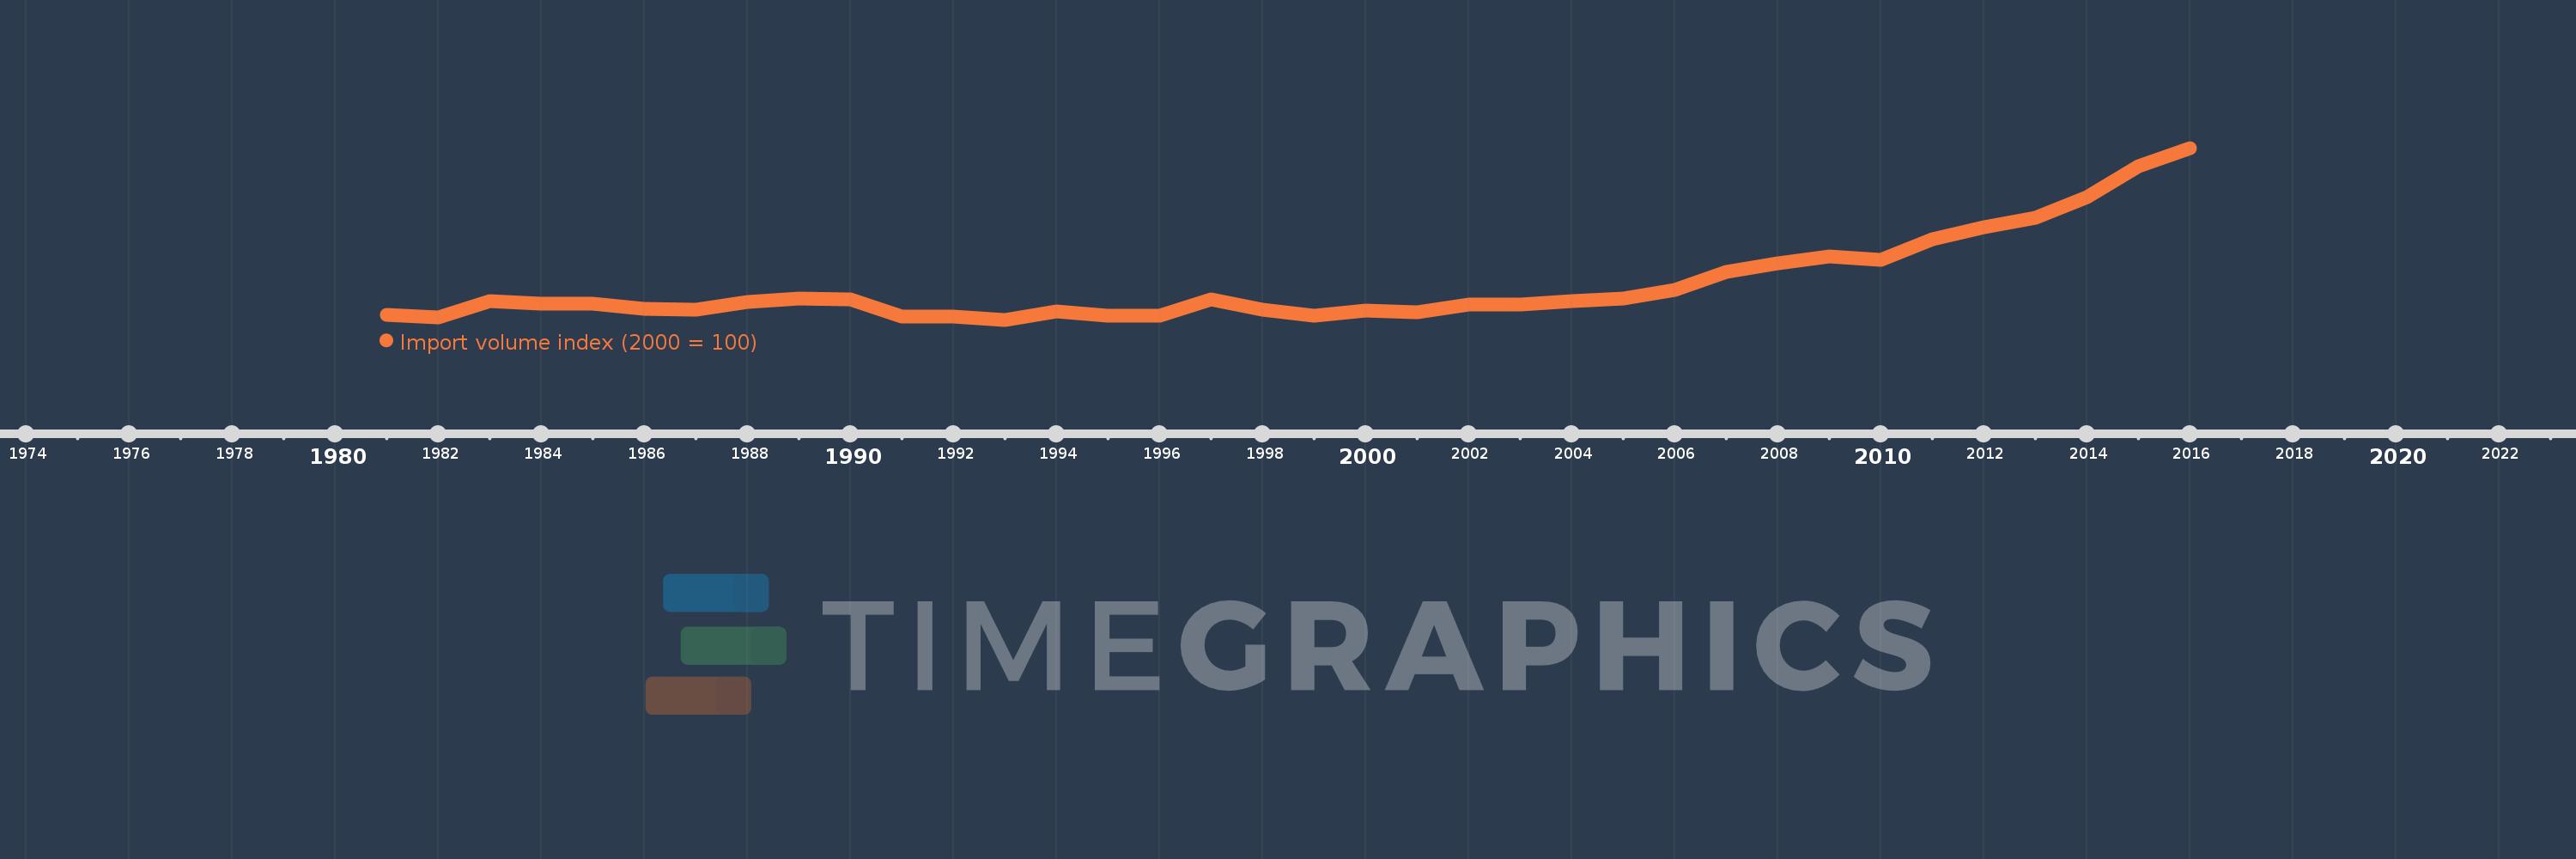
Import volume index (2000 = 100)
2016,2015,2014,2013,2012,2011,2010,2009,2008,2007,2006,2005,2004,2003,2002,2001,2000,1999,1998,1997,1996,1995,1994,1993,1992,1991,1990,1989,1988,1987,1986,1985,1984,1983,1982,1981
This statistics in other country:
AfghanistanAlbaniaAlgeriaAmerican SamoaAndorraAngolaAntigua and BarbudaArgentinaArmeniaArubaAustraliaAustriaAzerbaijanBahamas, TheBahrainBangladeshBarbadosBelarusBelgiumBelizeBeninBermudaBhutanBoliviaBosnia and HerzegovinaBotswanaBrazilBritish Virgin IslandsBrunei DarussalamBulgariaBurkina FasoBurundiCabo VerdeCambodiaCameroonCanadaCayman IslandsCentral African RepublicChadChileChinaColombiaComorosCongo, Dem. Rep.Congo, Rep.Costa RicaCote d'IvoireCroatiaCubaCuracaoCyprusCzech RepublicDenmarkDjiboutiDominicaDominican RepublicEcuadorEgypt, Arab Rep.El SalvadorEquatorial GuineaEritreaEstoniaEthiopiaFaroe IslandsFijiFinlandFranceFrench PolynesiaGabonGambia, TheGeorgiaGermanyGhanaGibraltarGreeceGreenlandGrenadaGuamGuatemalaGuineaGuinea-BissauGuyanaHaitiHondurasHong Kong SAR, ChinaHungaryIcelandIndiaIndonesiaIran, Islamic Rep.IraqIrelandIsraelItalyJamaicaJapanJordanKazakhstanKenyaKiribatiKorea, Dem. People’s Rep.Korea, Rep.KuwaitKyrgyz RepublicLao PDRLatviaLebanonLesothoLiberiaLibyaLithuaniaLuxembourgMacao SAR, ChinaMacedonia, FYRMadagascarMalawiMalaysiaMaldivesMaliMaltaMarshall IslandsMauritaniaMauritiusMexicoMicronesia, Fed. Sts.MoldovaMongoliaMoroccoMozambiqueMyanmarNamibiaNauruNepalNetherlandsNew CaledoniaNew ZealandNicaraguaNigerNigeriaNorthern Mariana IslandsNorwayOmanPakistanPalauPanamaPapua New GuineaParaguayPeruPhilippinesPolandPortugalQatarRomaniaRussian FederationRwandaSamoaSao Tome and PrincipeSaudi ArabiaSenegalSerbiaSeychellesSierra LeoneSingaporeSlovak RepublicSloveniaSolomon IslandsSomaliaSouth AfricaSpainSri LankaSt. Kitts and NevisSt. LuciaSt. Vincent and the GrenadinesSudanSurinameSwazilandSwedenSwitzerlandSyrian Arab RepublicTajikistanTanzaniaThailandTogoTongaTrinidad and TobagoTunisiaTurkeyTurkmenistanTurks and Caicos IslandsUgandaUkraineUnited Arab EmiratesUnited KingdomUnited StatesUruguayUzbekistanVanuatuVenezuela, RBVietnamWest Bank and GazaYemen, Rep.ZambiaZimbabwe Timeline:
This timeline shows a graph from 1981 to 2016 of Congo, Rep.. No data until 1980. Number of actual observations by date: 36.
Source name:
World Development Indicators
Source organization:
United Nations Conference on Trade and Development, Handbook of Statistics and data files, and International Monetary Fund, International Financial Statistics.
Categories, topics:
Private Sector, Trade
Last updated:
apr 23, 2017
Indicators value changes by year
Minimum:
53.502
jan 1, 1993
Maximum:
1.119K
jan 1, 2016
At the date of observation
Value
Absolute change
Change from previous value
jan 1, 1981
82.68
+82.68
0.0%
jan 1, 1982
66.698
-15.982
-19.33%
jan 1, 1983
167.519
+100.821
151.16%
jan 1, 1984
151.071
-16.448
-9.82%
jan 1, 1985
151.59
+0.52
0.34%
jan 1, 1986
123.012
-28.579
-18.85%
jan 1, 1987
115.913
-7.099
-5.77%
jan 1, 1988
163.086
+47.173
40.7%
jan 1, 1989
185.286
+22.2
13.61%
jan 1, 1990
180.019
-5.267
-2.84%
jan 1, 1991
74.21
-105.809
-58.78%
jan 1, 1992
72.289
-1.921
-2.59%
jan 1, 1993
53.502
-18.788
-25.99%
jan 1, 1994
105.705
+52.203
97.57%
jan 1, 1995
78.812
-26.893
-25.44%
jan 1, 1996
76.128
-2.684
-3.41%
jan 1, 1997
180.744
+104.616
137.42%
jan 1, 1998
117.774
-62.97
-34.84%
jan 1, 1999
76.107
-41.667
-35.38%
jan 1, 2000
110.349
+34.242
44.99%
jan 1, 2001
100.0
-10.349
-9.38%
jan 1, 2002
148.799
+48.799
48.8%
jan 1, 2003
147.826
-0.974
-0.65%
jan 1, 2004
170.53
+22.705
15.36%
jan 1, 2005
184.259
+13.729
8.05%
jan 1, 2006
237.965
+53.705
29.15%
jan 1, 2007
351.697
+113.733
47.79%
jan 1, 2008
405.412
+53.715
15.27%
jan 1, 2009
443.673
+38.261
9.44%
jan 1, 2010
424.123
-19.549
-4.41%
jan 1, 2011
550.611
+126.487
29.82%
jan 1, 2012
627.528
+76.918
13.97%
jan 1, 2013
687.704
+60.176
9.59%
jan 1, 2014
814.948
+127.244
18.5%
jan 1, 2015
1.004K
+188.804
23.17%
jan 1, 2016
1.119K
+114.941
11.45%
Ranking of countries by current statistics by years


Comments: