29
/
en
AIzaSyAYiBZKx7MnpbEhh9jyipgxe19OcubqV5w
April 1, 2024
195675
Mexico
MEX
true
2
1
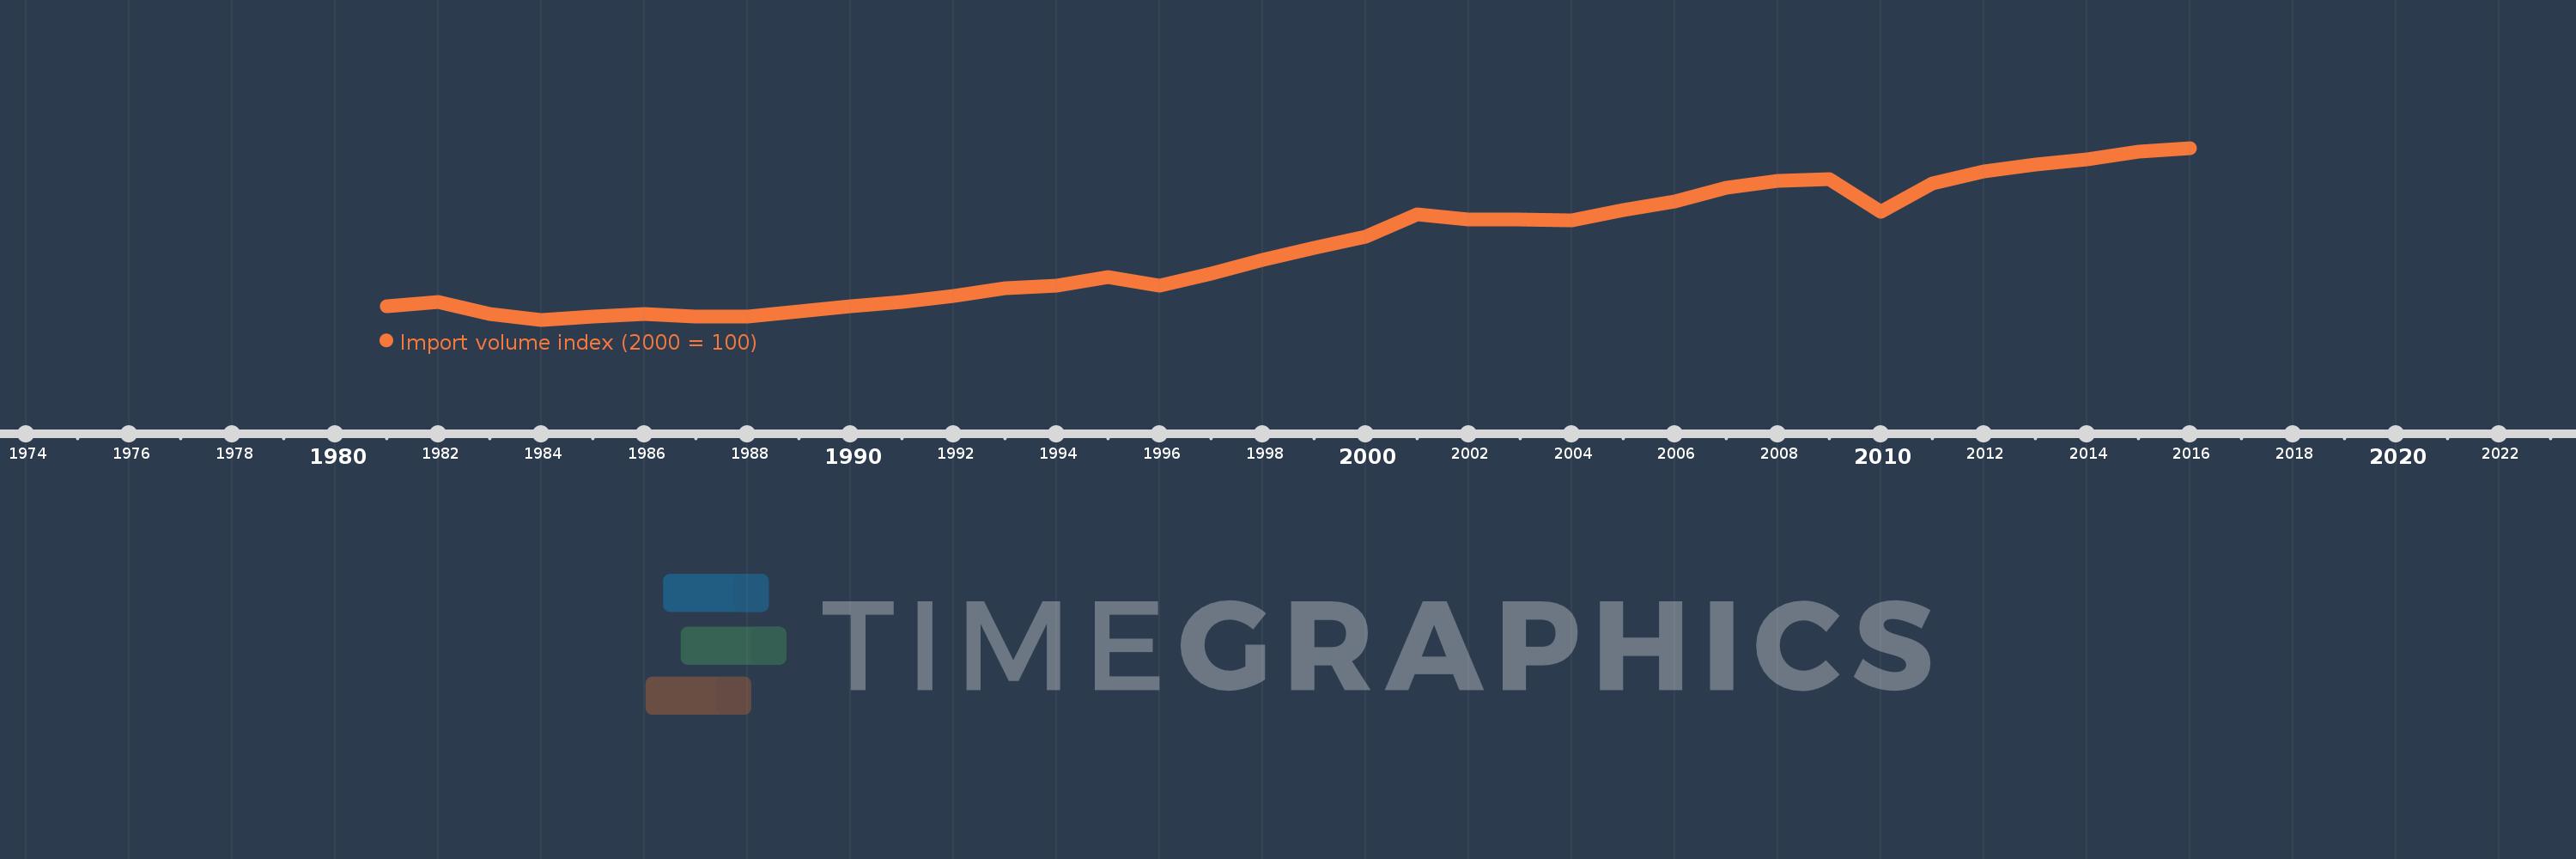
Import volume index (2000 = 100)
2016,2015,2014,2013,2012,2011,2010,2009,2008,2007,2006,2005,2004,2003,2002,2001,2000,1999,1998,1997,1996,1995,1994,1993,1992,1991,1990,1989,1988,1987,1986,1985,1984,1983,1982,1981
This statistics in other country:
AfghanistanAlbaniaAlgeriaAmerican SamoaAndorraAngolaAntigua and BarbudaArgentinaArmeniaArubaAustraliaAustriaAzerbaijanBahamas, TheBahrainBangladeshBarbadosBelarusBelgiumBelizeBeninBermudaBhutanBoliviaBosnia and HerzegovinaBotswanaBrazilBritish Virgin IslandsBrunei DarussalamBulgariaBurkina FasoBurundiCabo VerdeCambodiaCameroonCanadaCayman IslandsCentral African RepublicChadChileChinaColombiaComorosCongo, Dem. Rep.Congo, Rep.Costa RicaCote d'IvoireCroatiaCubaCuracaoCyprusCzech RepublicDenmarkDjiboutiDominicaDominican RepublicEcuadorEgypt, Arab Rep.El SalvadorEquatorial GuineaEritreaEstoniaEthiopiaFaroe IslandsFijiFinlandFranceFrench PolynesiaGabonGambia, TheGeorgiaGermanyGhanaGibraltarGreeceGreenlandGrenadaGuamGuatemalaGuineaGuinea-BissauGuyanaHaitiHondurasHong Kong SAR, ChinaHungaryIcelandIndiaIndonesiaIran, Islamic Rep.IraqIrelandIsraelItalyJamaicaJapanJordanKazakhstanKenyaKiribatiKorea, Dem. People’s Rep.Korea, Rep.KuwaitKyrgyz RepublicLao PDRLatviaLebanonLesothoLiberiaLibyaLithuaniaLuxembourgMacao SAR, ChinaMacedonia, FYRMadagascarMalawiMalaysiaMaldivesMaliMaltaMarshall IslandsMauritaniaMauritiusMexicoMicronesia, Fed. Sts.MoldovaMongoliaMoroccoMozambiqueMyanmarNamibiaNauruNepalNetherlandsNew CaledoniaNew ZealandNicaraguaNigerNigeriaNorthern Mariana IslandsNorwayOmanPakistanPalauPanamaPapua New GuineaParaguayPeruPhilippinesPolandPortugalQatarRomaniaRussian FederationRwandaSamoaSao Tome and PrincipeSaudi ArabiaSenegalSerbiaSeychellesSierra LeoneSingaporeSlovak RepublicSloveniaSolomon IslandsSomaliaSouth AfricaSpainSri LankaSt. Kitts and NevisSt. LuciaSt. Vincent and the GrenadinesSudanSurinameSwazilandSwedenSwitzerlandSyrian Arab RepublicTajikistanTanzaniaThailandTogoTongaTrinidad and TobagoTunisiaTurkeyTurkmenistanTurks and Caicos IslandsUgandaUkraineUnited Arab EmiratesUnited KingdomUnited StatesUruguayUzbekistanVanuatuVenezuela, RBVietnamWest Bank and GazaYemen, Rep.ZambiaZimbabwe Timeline:
This timeline shows a graph from 1981 to 2016 of Mexico. No data until 1980. Number of actual observations by date: 36.
Source name:
World Development Indicators
Source organization:
United Nations Conference on Trade and Development, Handbook of Statistics and data files, and International Monetary Fund, International Financial Statistics.
Categories, topics:
Private Sector, Trade
Last updated:
apr 23, 2017
Indicators value changes by year
Minimum:
10.042
jan 1, 1984
Maximum:
157.246
jan 1, 2016
At the date of observation
Value
Absolute change
Change from previous value
jan 1, 1981
21.643
+21.643
0.0%
jan 1, 1982
25.538
+3.895
18.0%
jan 1, 1983
15.173
-10.365
-40.59%
jan 1, 1984
10.042
-5.131
-33.82%
jan 1, 1985
13.051
+3.009
29.96%
jan 1, 1986
15.164
+2.113
16.19%
jan 1, 1987
12.824
-2.339
-15.43%
jan 1, 1988
12.989
+0.164
1.28%
jan 1, 1989
17.304
+4.315
33.22%
jan 1, 1990
21.423
+4.119
23.8%
jan 1, 1991
25.63
+4.207
19.64%
jan 1, 1992
30.789
+5.159
20.13%
jan 1, 1993
36.705
+5.916
19.21%
jan 1, 1994
39.02
+2.315
6.31%
jan 1, 1995
46.398
+7.378
18.91%
jan 1, 1996
39.17
-7.228
-15.58%
jan 1, 1997
49.778
+10.608
27.08%
jan 1, 1998
61.628
+11.85
23.81%
jan 1, 1999
71.673
+10.045
16.3%
jan 1, 2000
81.361
+9.688
13.52%
jan 1, 2001
100.0
+18.639
22.91%
jan 1, 2002
95.87
-4.13
-4.13%
jan 1, 2003
96.268
+0.398
0.41%
jan 1, 2004
95.071
-1.197
-1.24%
jan 1, 2005
104.014
+8.943
9.41%
jan 1, 2006
111.723
+7.71
7.41%
jan 1, 2007
123.362
+11.639
10.42%
jan 1, 2008
128.907
+5.545
4.49%
jan 1, 2009
130.395
+1.488
1.15%
jan 1, 2010
102.847
-27.548
-21.13%
jan 1, 2011
126.658
+23.81
23.15%
jan 1, 2012
137.44
+10.782
8.51%
jan 1, 2013
143.32
+5.88
4.28%
jan 1, 2014
147.583
+4.263
2.97%
jan 1, 2015
154.266
+6.682
4.53%
jan 1, 2016
157.246
+2.98
1.93%
Ranking of countries by current statistics by years


Comments: