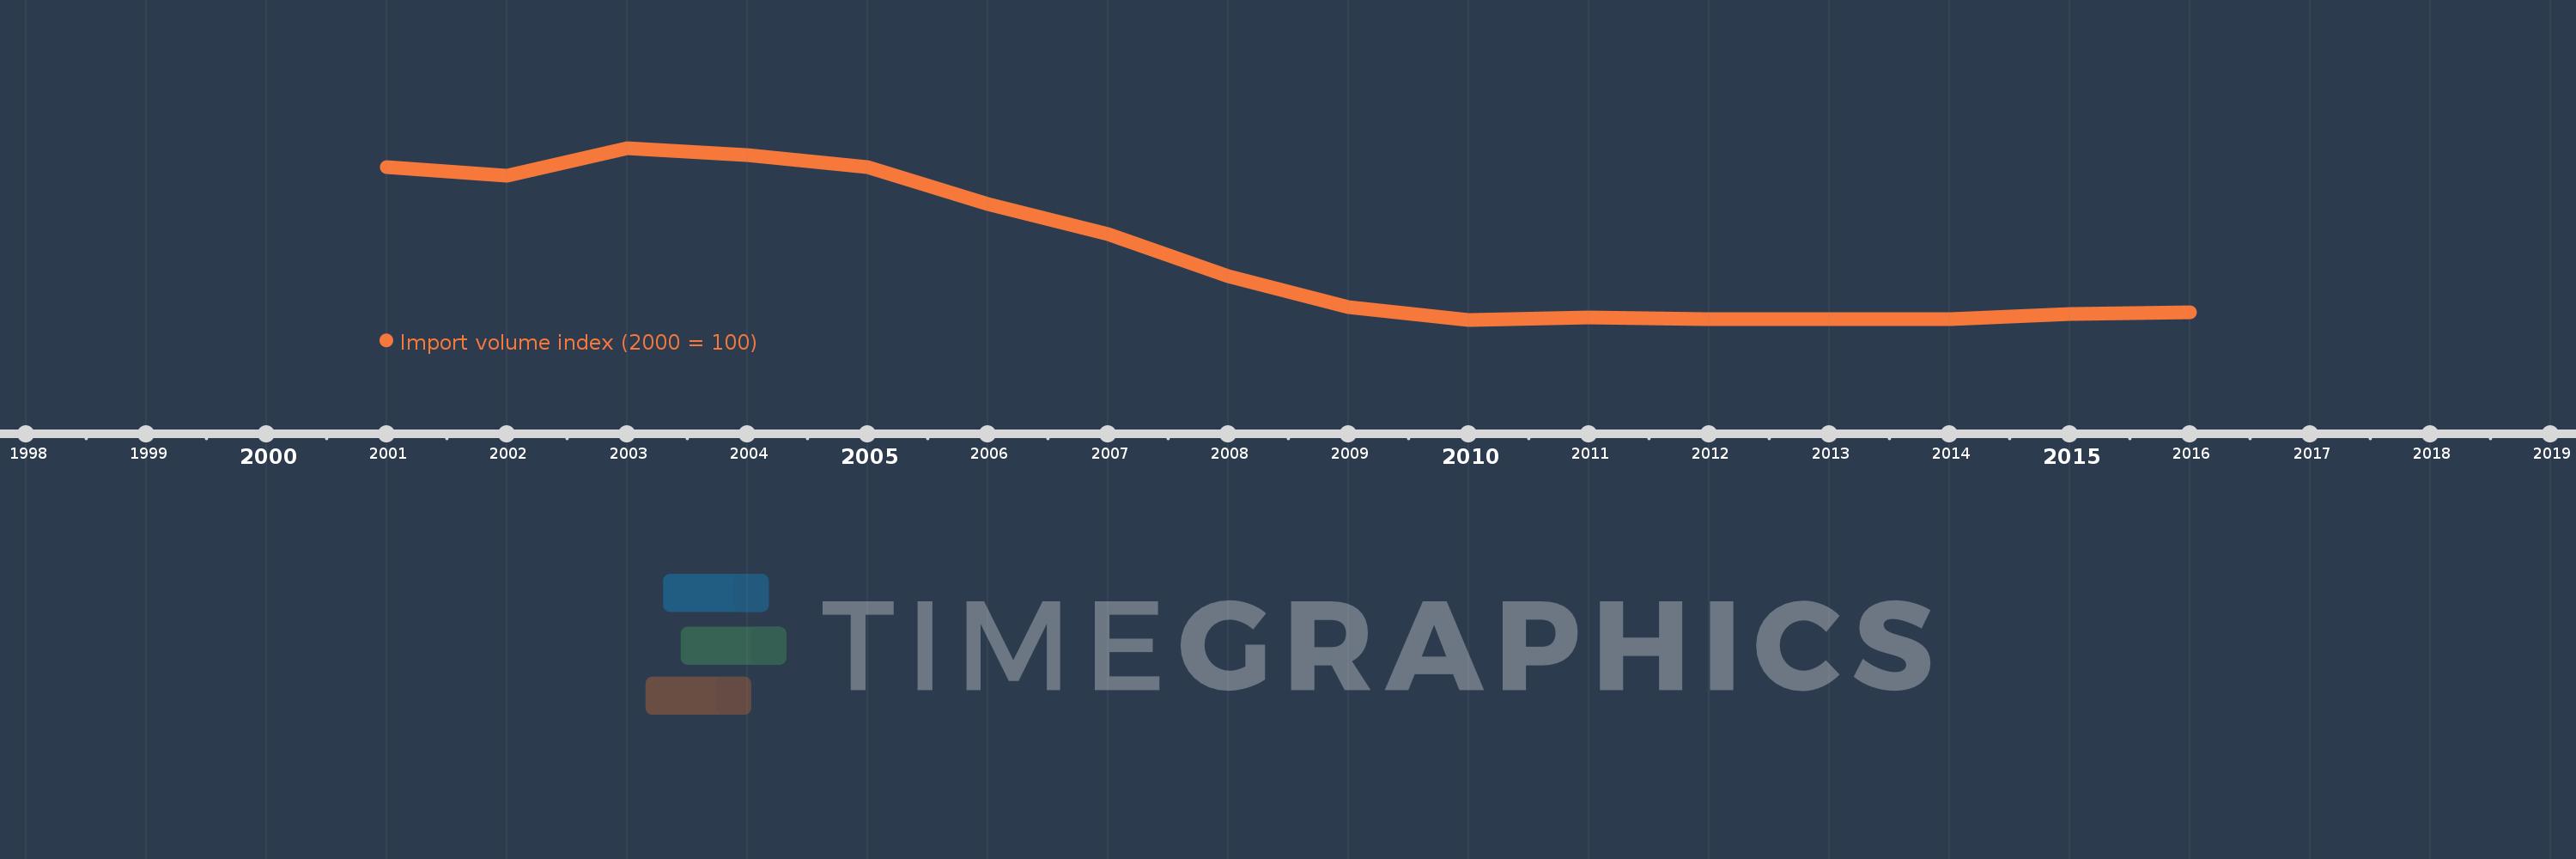
This timeline shows a graph from 2001 to 2016 of Northern Mariana Islands. No data until 2000. Number of actual observations by date: 16.
Source name:
World Development Indicators
Source organization:
United Nations Conference on Trade and Development, Handbook of Statistics and data files, and International Monetary Fund, International Financial Statistics.
Categories, topics:
Private Sector, Trade
Last updated:
apr 23, 2017
Indicators value changes by year
Meaning:
47.952
Minimum:
7.926
jan 1, 2010
Maximum:
111.775
jan 1, 2003
At the date of observation
Value
Absolute change
Change from the previous value
jan 1, 2001
100.0
+100.0
0.0%
jan 1, 2002
95.077
-4.923
-4.92%
jan 1, 2003
111.775
+16.697
17.56%
jan 1, 2004
107.635
-4.14
-3.7%
jan 1, 2005
100.193
-7.442
-6.91%
jan 1, 2006
77.826
-22.367
-22.32%
jan 1, 2007
59.688
-18.138
-23.31%
jan 1, 2008
34.334
-25.354
-42.48%
jan 1, 2009
15.413
-18.921
-55.11%
jan 1, 2010
7.926
-7.487
-48.58%
jan 1, 2011
9.212
+1.286
16.23%
jan 1, 2012
8.174
-1.038
-11.27%
jan 1, 2013
8.033
-0.141
-1.73%
jan 1, 2014
8.485
+0.452
5.63%
jan 1, 2015
11.159
+2.674
31.52%
jan 1, 2016
12.308
+1.149
10.3%
Ranking of countries by current statistics by years
