29
/
en
AIzaSyAYiBZKx7MnpbEhh9jyipgxe19OcubqV5w
April 1, 2024
281099
Venezuela, RB
VEN
true
2
1
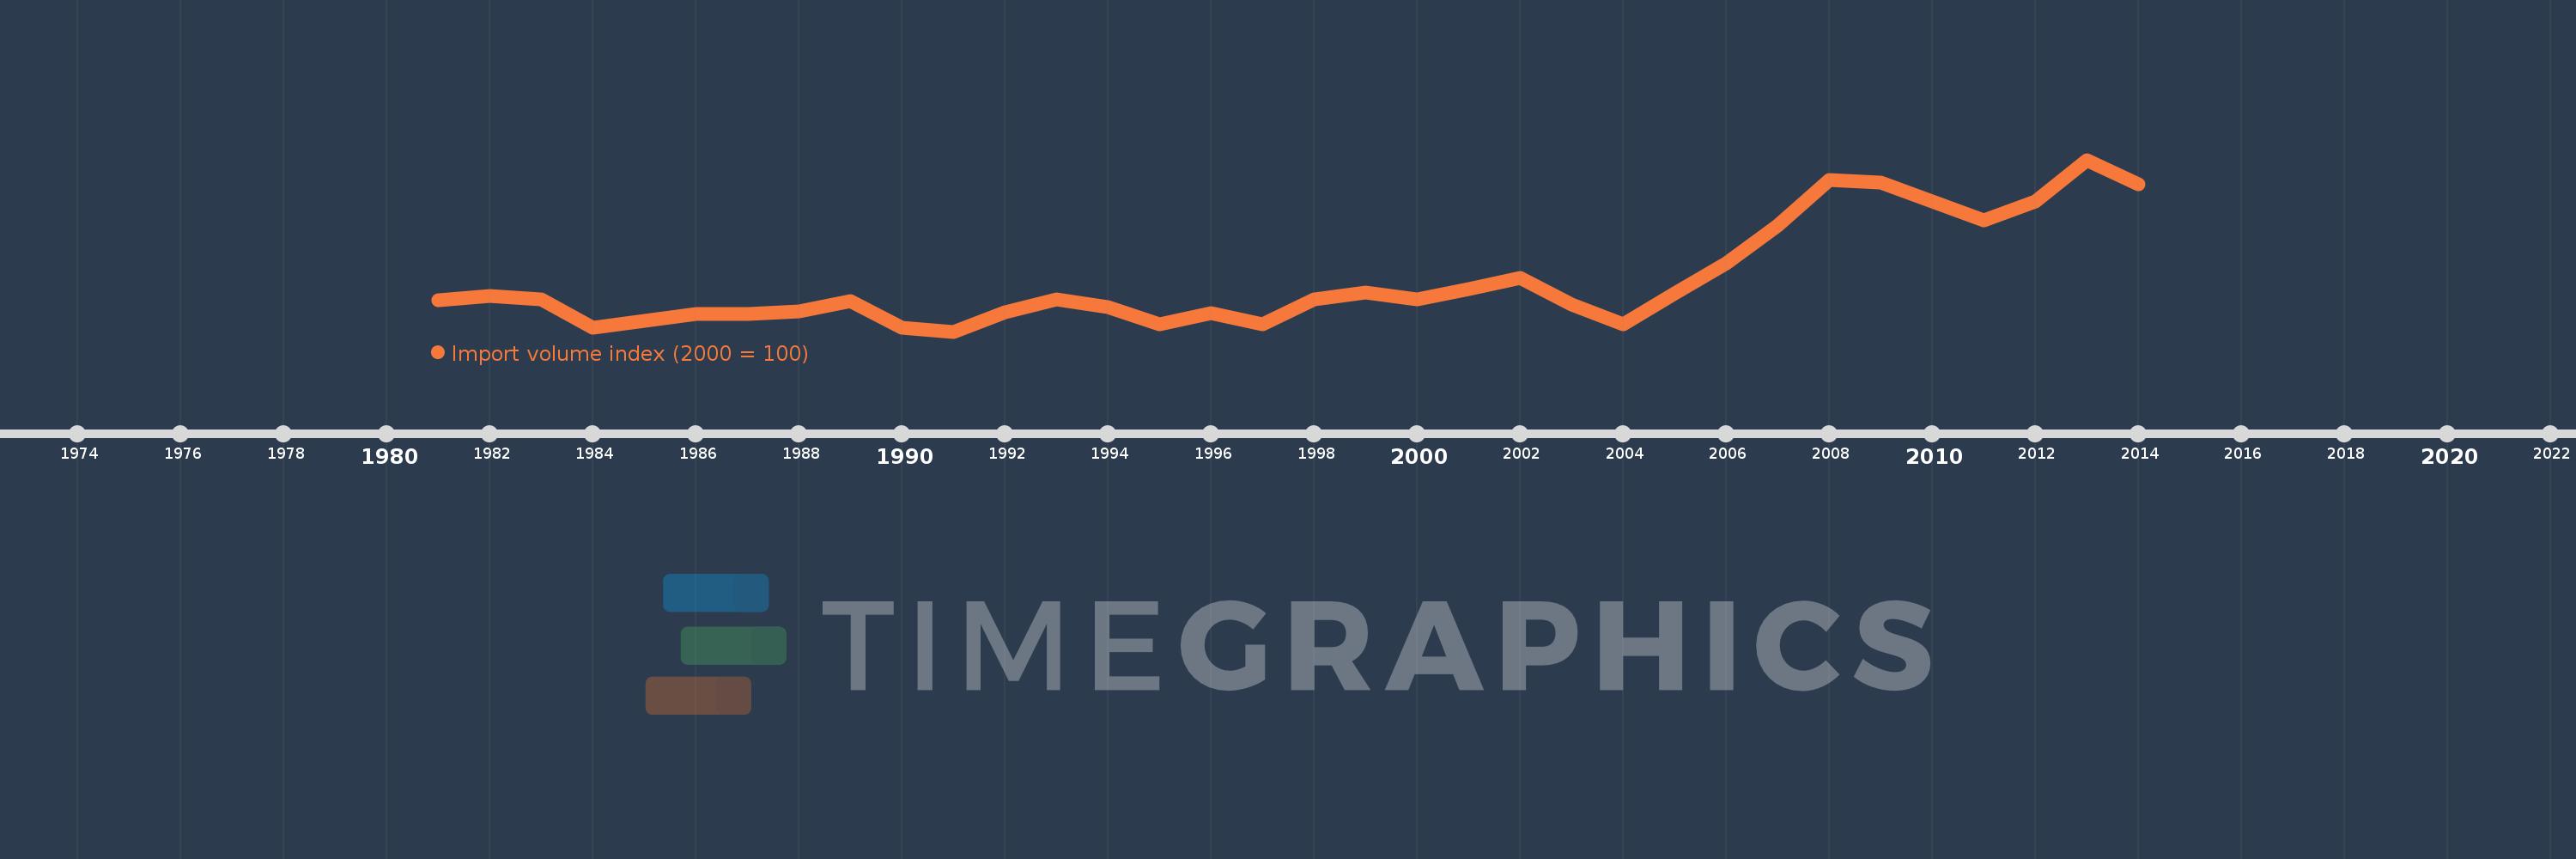
Import volume index (2000 = 100)
2014,2013,2012,2011,2010,2009,2008,2007,2006,2005,2004,2003,2002,2001,2000,1999,1998,1997,1996,1995,1994,1993,1992,1991,1990,1989,1988,1987,1986,1985,1984,1983,1982,1981
This statistics in other country:
AfghanistanAlbaniaAlgeriaAmerican SamoaAndorraAngolaAntigua and BarbudaArgentinaArmeniaArubaAustraliaAustriaAzerbaijanBahamas, TheBahrainBangladeshBarbadosBelarusBelgiumBelizeBeninBermudaBhutanBoliviaBosnia and HerzegovinaBotswanaBrazilBritish Virgin IslandsBrunei DarussalamBulgariaBurkina FasoBurundiCabo VerdeCambodiaCameroonCanadaCayman IslandsCentral African RepublicChadChileChinaColombiaComorosCongo, Dem. Rep.Congo, Rep.Costa RicaCote d'IvoireCroatiaCubaCuracaoCyprusCzech RepublicDenmarkDjiboutiDominicaDominican RepublicEcuadorEgypt, Arab Rep.El SalvadorEquatorial GuineaEritreaEstoniaEthiopiaFaroe IslandsFijiFinlandFranceFrench PolynesiaGabonGambia, TheGeorgiaGermanyGhanaGibraltarGreeceGreenlandGrenadaGuamGuatemalaGuineaGuinea-BissauGuyanaHaitiHondurasHong Kong SAR, ChinaHungaryIcelandIndiaIndonesiaIran, Islamic Rep.IraqIrelandIsraelItalyJamaicaJapanJordanKazakhstanKenyaKiribatiKorea, Dem. People’s Rep.Korea, Rep.KuwaitKyrgyz RepublicLao PDRLatviaLebanonLesothoLiberiaLibyaLithuaniaLuxembourgMacao SAR, ChinaMacedonia, FYRMadagascarMalawiMalaysiaMaldivesMaliMaltaMarshall IslandsMauritaniaMauritiusMexicoMicronesia, Fed. Sts.MoldovaMongoliaMoroccoMozambiqueMyanmarNamibiaNauruNepalNetherlandsNew CaledoniaNew ZealandNicaraguaNigerNigeriaNorthern Mariana IslandsNorwayOmanPakistanPalauPanamaPapua New GuineaParaguayPeruPhilippinesPolandPortugalQatarRomaniaRussian FederationRwandaSamoaSao Tome and PrincipeSaudi ArabiaSenegalSerbiaSeychellesSierra LeoneSingaporeSlovak RepublicSloveniaSolomon IslandsSomaliaSouth AfricaSpainSri LankaSt. Kitts and NevisSt. LuciaSt. Vincent and the GrenadinesSudanSurinameSwazilandSwedenSwitzerlandSyrian Arab RepublicTajikistanTanzaniaThailandTogoTongaTrinidad and TobagoTunisiaTurkeyTurkmenistanTurks and Caicos IslandsUgandaUkraineUnited Arab EmiratesUnited KingdomUnited StatesUruguayUzbekistanVanuatuVenezuela, RBVietnamWest Bank and GazaYemen, Rep.ZambiaZimbabwe Timeline:
This timeline shows a graph from 1981 to 2014 of Venezuela, RB. No data until 1980. Number of actual observations by date: 34.
Source name:
World Development Indicators
Source organization:
United Nations Conference on Trade and Development, Handbook of Statistics and data files, and International Monetary Fund, International Financial Statistics.
Categories, topics:
Private Sector, Trade
Last updated:
apr 23, 2017
Indicators value changes by year
Minimum:
47.127
jan 1, 1991
Maximum:
260.913
jan 1, 2013
At the date of observation
Value
Absolute change
Change from previous value
jan 1, 1981
85.821
+85.821
0.0%
jan 1, 1982
91.86
+6.039
7.04%
jan 1, 1983
87.733
-4.126
-4.49%
jan 1, 1984
51.418
-36.315
-41.39%
jan 1, 1985
60.695
+9.277
18.04%
jan 1, 1986
69.44
+8.745
14.41%
jan 1, 1987
69.015
-0.425
-0.61%
jan 1, 1988
71.778
+2.762
4.0%
jan 1, 1989
85.318
+13.54
18.86%
jan 1, 1990
51.751
-33.567
-39.34%
jan 1, 1991
47.127
-4.624
-8.94%
jan 1, 1992
70.88
+23.753
50.4%
jan 1, 1993
86.758
+15.878
22.4%
jan 1, 1994
77.166
-9.591
-11.06%
jan 1, 1995
56.103
-21.063
-27.3%
jan 1, 1996
69.664
+13.561
24.17%
jan 1, 1997
55.907
-13.757
-19.75%
jan 1, 1998
87.47
+31.563
56.46%
jan 1, 1999
95.651
+8.18
9.35%
jan 1, 2000
86.745
-8.905
-9.31%
jan 1, 2001
100.0
+13.255
15.28%
jan 1, 2002
113.423
+13.423
13.42%
jan 1, 2003
80.648
-32.775
-28.9%
jan 1, 2004
56.458
-24.19
-29.99%
jan 1, 2005
95.08
+38.622
68.41%
jan 1, 2006
131.696
+36.617
38.51%
jan 1, 2007
178.895
+47.199
35.84%
jan 1, 2008
235.871
+56.975
31.85%
jan 1, 2009
232.564
-3.307
-1.4%
jan 1, 2010
209.052
-23.512
-10.11%
jan 1, 2011
185.165
-23.887
-11.43%
jan 1, 2012
209.066
+23.901
12.91%
jan 1, 2013
260.913
+51.846
24.8%
jan 1, 2014
230.902
-30.011
-11.5%
Ranking of countries by current statistics by years


Comments: