29
/
en
AIzaSyAYiBZKx7MnpbEhh9jyipgxe19OcubqV5w
April 1, 2024
113708
Cote d'Ivoire
CIV
true
2
1
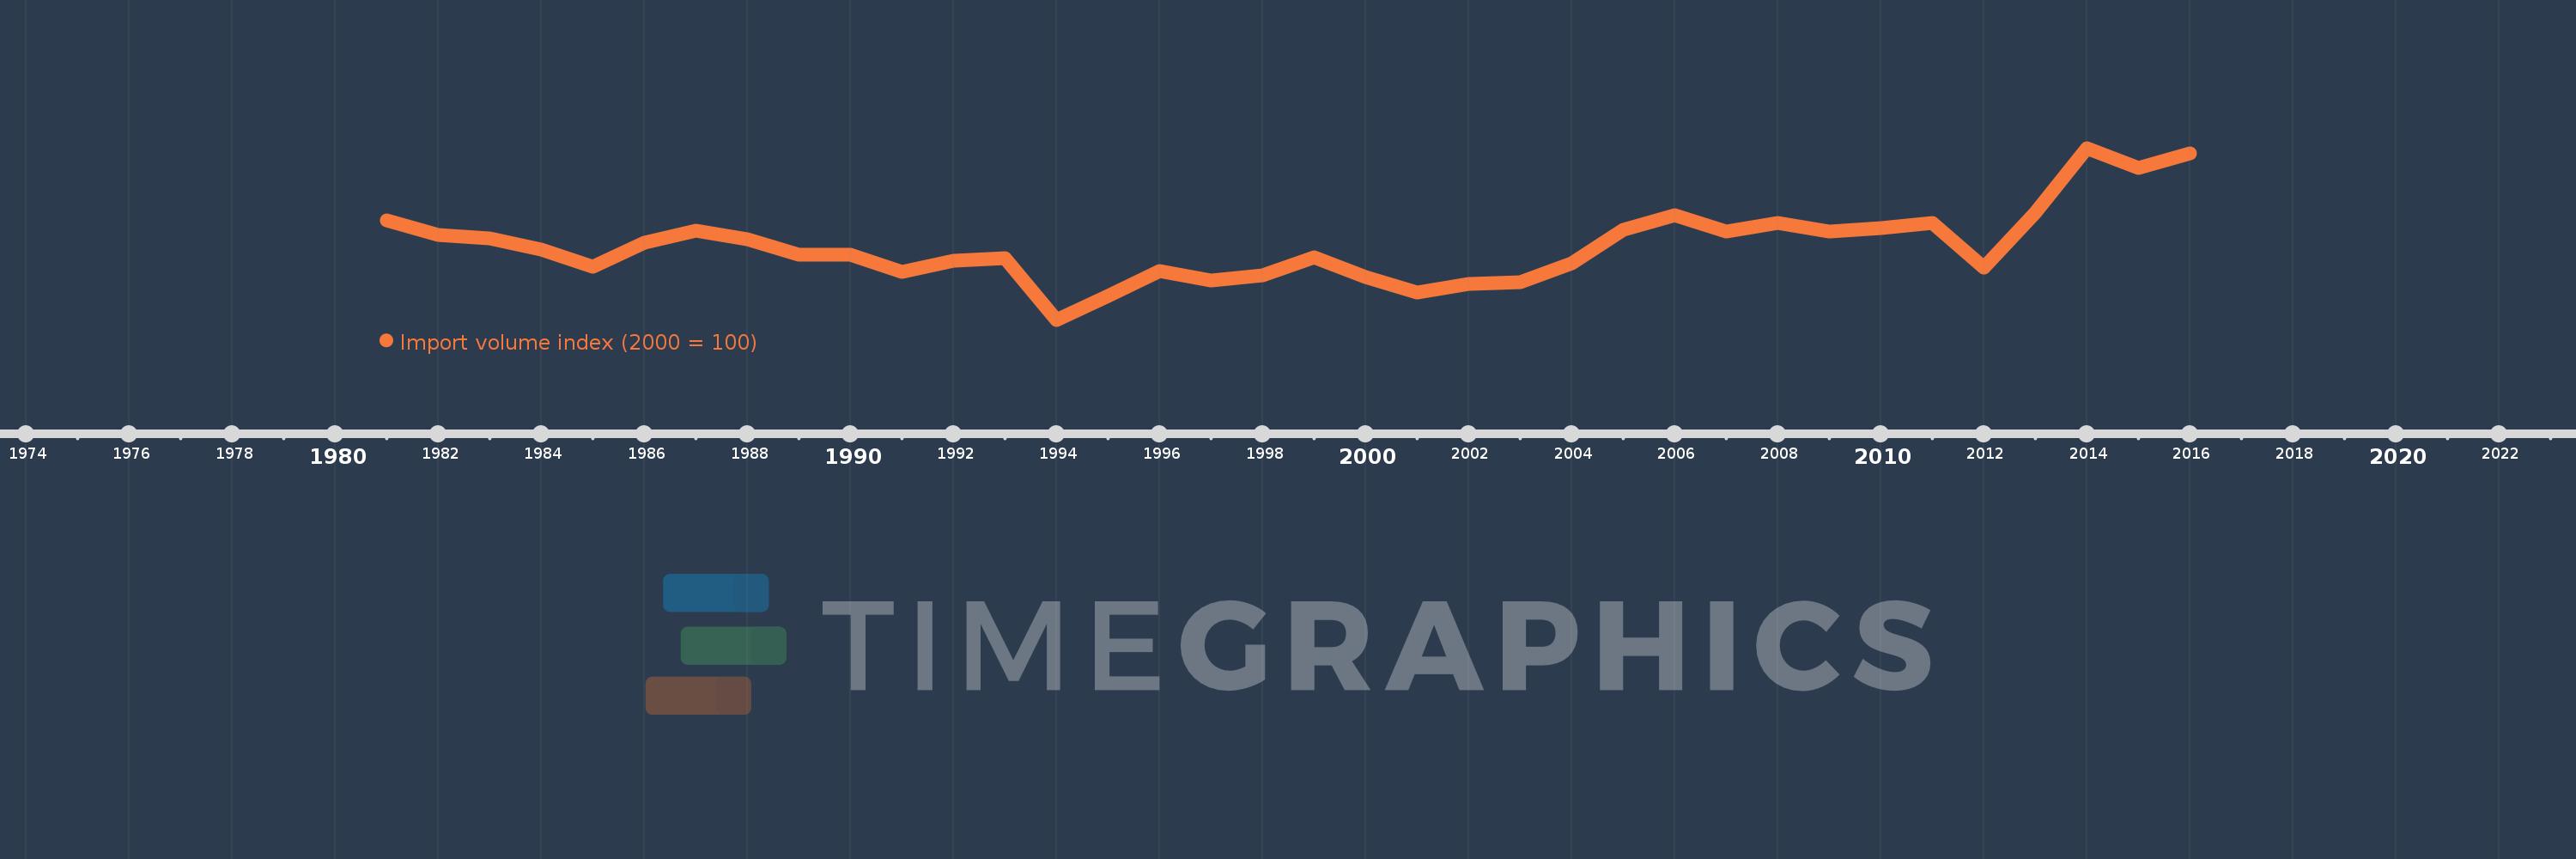
Import volume index (2000 = 100)
2016,2015,2014,2013,2012,2011,2010,2009,2008,2007,2006,2005,2004,2003,2002,2001,2000,1999,1998,1997,1996,1995,1994,1993,1992,1991,1990,1989,1988,1987,1986,1985,1984,1983,1982,1981
This statistics in other country:
AfghanistanAlbaniaAlgeriaAmerican SamoaAndorraAngolaAntigua and BarbudaArgentinaArmeniaArubaAustraliaAustriaAzerbaijanBahamas, TheBahrainBangladeshBarbadosBelarusBelgiumBelizeBeninBermudaBhutanBoliviaBosnia and HerzegovinaBotswanaBrazilBritish Virgin IslandsBrunei DarussalamBulgariaBurkina FasoBurundiCabo VerdeCambodiaCameroonCanadaCayman IslandsCentral African RepublicChadChileChinaColombiaComorosCongo, Dem. Rep.Congo, Rep.Costa RicaCote d'IvoireCroatiaCubaCuracaoCyprusCzech RepublicDenmarkDjiboutiDominicaDominican RepublicEcuadorEgypt, Arab Rep.El SalvadorEquatorial GuineaEritreaEstoniaEthiopiaFaroe IslandsFijiFinlandFranceFrench PolynesiaGabonGambia, TheGeorgiaGermanyGhanaGibraltarGreeceGreenlandGrenadaGuamGuatemalaGuineaGuinea-BissauGuyanaHaitiHondurasHong Kong SAR, ChinaHungaryIcelandIndiaIndonesiaIran, Islamic Rep.IraqIrelandIsraelItalyJamaicaJapanJordanKazakhstanKenyaKiribatiKorea, Dem. People’s Rep.Korea, Rep.KuwaitKyrgyz RepublicLao PDRLatviaLebanonLesothoLiberiaLibyaLithuaniaLuxembourgMacao SAR, ChinaMacedonia, FYRMadagascarMalawiMalaysiaMaldivesMaliMaltaMarshall IslandsMauritaniaMauritiusMexicoMicronesia, Fed. Sts.MoldovaMongoliaMoroccoMozambiqueMyanmarNamibiaNauruNepalNetherlandsNew CaledoniaNew ZealandNicaraguaNigerNigeriaNorthern Mariana IslandsNorwayOmanPakistanPalauPanamaPapua New GuineaParaguayPeruPhilippinesPolandPortugalQatarRomaniaRussian FederationRwandaSamoaSao Tome and PrincipeSaudi ArabiaSenegalSerbiaSeychellesSierra LeoneSingaporeSlovak RepublicSloveniaSolomon IslandsSomaliaSouth AfricaSpainSri LankaSt. Kitts and NevisSt. LuciaSt. Vincent and the GrenadinesSudanSurinameSwazilandSwedenSwitzerlandSyrian Arab RepublicTajikistanTanzaniaThailandTogoTongaTrinidad and TobagoTunisiaTurkeyTurkmenistanTurks and Caicos IslandsUgandaUkraineUnited Arab EmiratesUnited KingdomUnited StatesUruguayUzbekistanVanuatuVenezuela, RBVietnamWest Bank and GazaYemen, Rep.ZambiaZimbabwe Timeline:
This timeline shows a graph from 1981 to 2016 of Cote d'Ivoire. No data until 1980. Number of actual observations by date: 36.
Source name:
World Development Indicators
Source organization:
United Nations Conference on Trade and Development, Handbook of Statistics and data files, and International Monetary Fund, International Financial Statistics.
Categories, topics:
Private Sector, Trade
Last updated:
apr 23, 2017
Indicators value changes by year
Minimum:
71.029
jan 1, 1994
Maximum:
251.696
jan 1, 2014
At the date of observation
Value
Absolute change
Change from previous value
jan 1, 1981
175.401
+175.401
0.0%
jan 1, 1982
160.024
-15.377
-8.77%
jan 1, 1983
156.51
-3.515
-2.2%
jan 1, 1984
144.481
-12.028
-7.69%
jan 1, 1985
127.193
-17.289
-11.97%
jan 1, 1986
151.725
+24.532
19.29%
jan 1, 1987
164.522
+12.797
8.43%
jan 1, 1988
155.492
-9.031
-5.49%
jan 1, 1989
139.667
-15.824
-10.18%
jan 1, 1990
139.518
-0.149
-0.11%
jan 1, 1991
121.299
-18.219
-13.06%
jan 1, 1992
132.689
+11.391
9.39%
jan 1, 1993
136.036
+3.347
2.52%
jan 1, 1994
71.029
-65.007
-47.79%
jan 1, 1995
96.189
+25.159
35.42%
jan 1, 1996
122.035
+25.846
26.87%
jan 1, 1997
111.875
-10.159
-8.32%
jan 1, 1998
118.147
+6.271
5.61%
jan 1, 1999
136.568
+18.421
15.59%
jan 1, 2000
116.333
-20.235
-14.82%
jan 1, 2001
100.0
-16.333
-14.04%
jan 1, 2002
108.664
+8.664
8.66%
jan 1, 2003
110.384
+1.72
1.58%
jan 1, 2004
130.015
+19.631
17.78%
jan 1, 2005
165.976
+35.961
27.66%
jan 1, 2006
180.777
+14.801
8.92%
jan 1, 2007
164.197
-16.58
-9.17%
jan 1, 2008
172.79
+8.593
5.23%
jan 1, 2009
163.728
-9.062
-5.24%
jan 1, 2010
167.844
+4.116
2.51%
jan 1, 2011
172.76
+4.916
2.93%
jan 1, 2012
126.105
-46.655
-27.01%
jan 1, 2013
183.661
+57.556
45.64%
jan 1, 2014
251.696
+68.035
37.04%
jan 1, 2015
231.047
-20.649
-8.2%
jan 1, 2016
245.589
+14.542
6.29%
Ranking of countries by current statistics by years


Comments: