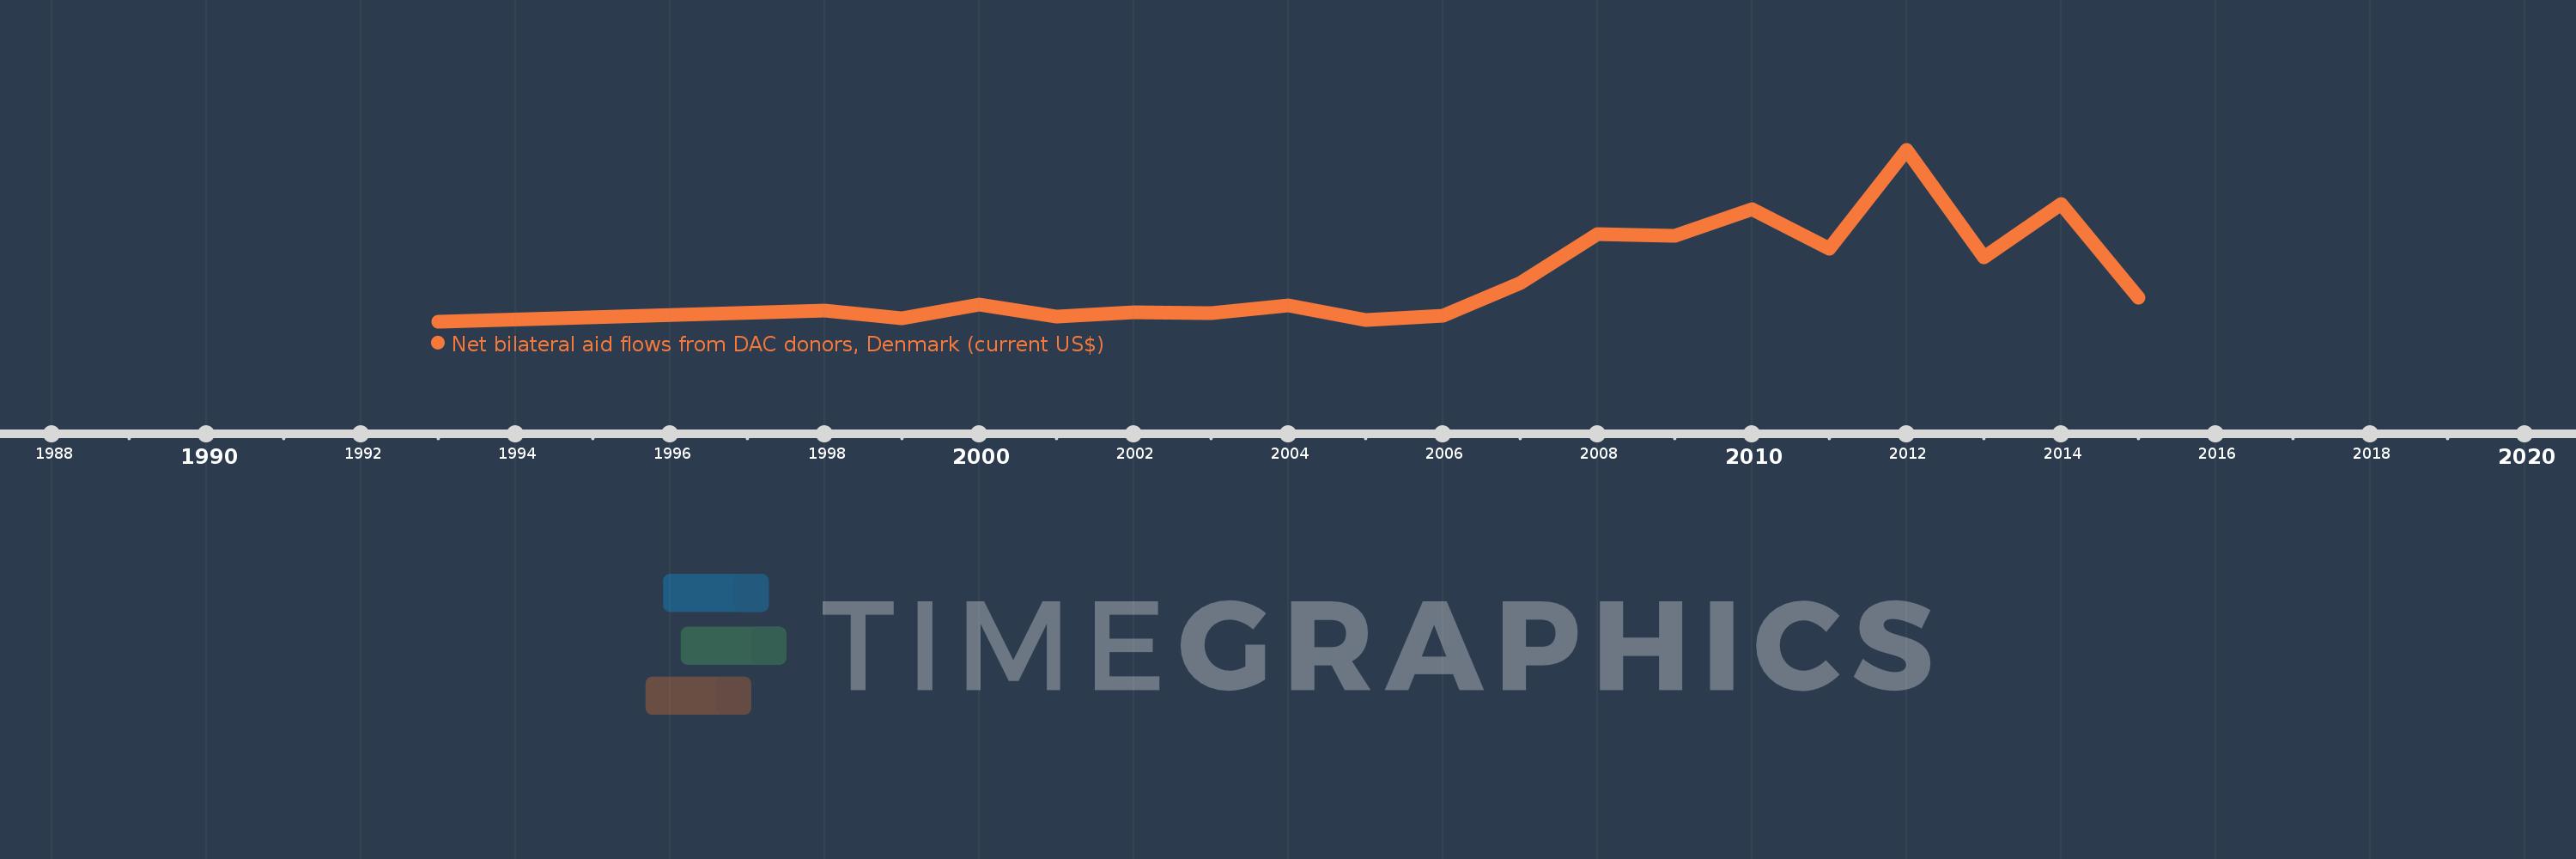
This timeline shows a graph from 1993 to 2015 of Armenia. No data until 1992. Number of actual observations by date: 19.
Source name:
World Development Indicators
Source organization:
Development Assistance Committee of the Organisation for Economic Co-operation and Development, Geographical Distribution of Financial Flows to Developing Countries, Development Co-operation Report, and International Development Statistics database. Data are available online at: www.oecd.org/dac/stats/idsonline.
Categories, topics:
Aid Effectiveness
Last updated:
apr 23, 2017
Indicators value changes by year
Meaning:
1.102 mln
Minimum:
10.0K
jan 1, 1993
Maximum:
4.16 mln
jan 1, 2012
At the date of observation
Value
Absolute change
Change from the previous value
jan 1, 1993
10.0K
+10.0K
0.0%
jan 1, 1998
290.0K
+280.0K
2.8K%
jan 1, 1999
90.0K
-200.0K
-68.97%
jan 1, 2000
430.0K
+340.0K
377.78%
jan 1, 2001
140.0K
-290.0K
-67.44%
jan 1, 2002
250.0K
+110.0K
78.57%
jan 1, 2003
220.0K
-30.0K
-12.0%
jan 1, 2004
410.0K
+190.0K
86.36%
jan 1, 2005
60.0K
-350.0K
-85.37%
jan 1, 2006
160.0K
+100.0K
166.67%
jan 1, 2007
940.0K
+780.0K
487.5%
jan 1, 2008
2.14 mln
+1.2 mln
127.66%
jan 1, 2009
2.09 mln
-50.0K
-2.34%
jan 1, 2010
2.74 mln
+650.0K
31.1%
jan 1, 2011
1.78 mln
-960.0K
-35.04%
jan 1, 2012
4.16 mln
+2.38 mln
133.71%
jan 1, 2013
1.57 mln
-2.59 mln
-62.26%
jan 1, 2014
2.86 mln
+1.29 mln
82.17%
jan 1, 2015
590.0K
-2.27 mln
-79.37%
Ranking of countries by current statistics by years
