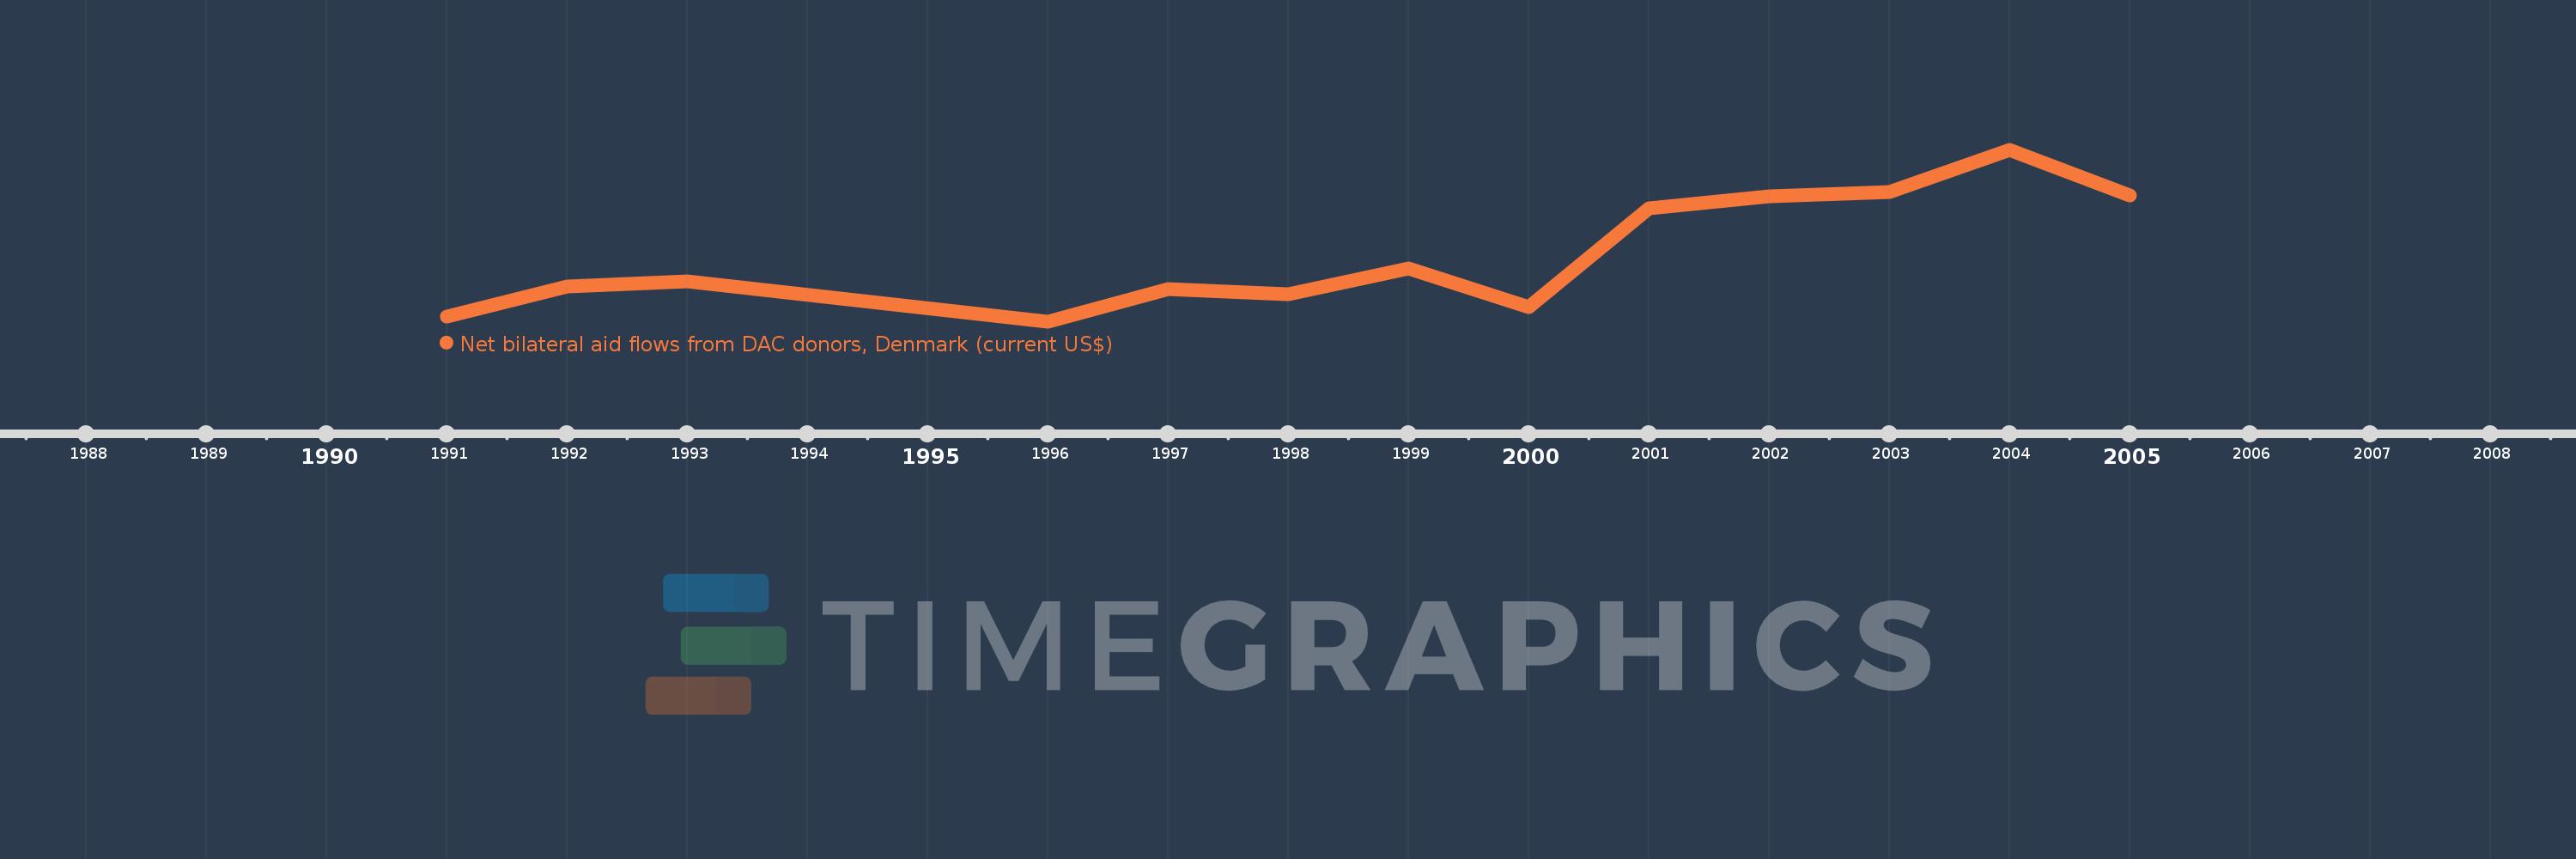
This timeline shows a graph from 1991 to 2005 of Slovak Republic. No data until 1990. Number of actual observations by date: 13.
Source name:
World Development Indicators
Source organization:
Development Assistance Committee of the Organisation for Economic Co-operation and Development, Geographical Distribution of Financial Flows to Developing Countries, Development Co-operation Report, and International Development Statistics database. Data are available online at: www.oecd.org/dac/stats/idsonline.
Categories, topics:
Aid Effectiveness
Last updated:
apr 23, 2017
Indicators value changes by year
Meaning:
2.091 mln
Minimum:
90.0K
jan 1, 1996
Maximum:
5.17 mln
jan 1, 2004
At the date of observation
Value
Absolute change
Change from the previous value
jan 1, 1991
260.0K
+260.0K
0.0%
jan 1, 1992
1.13 mln
+870.0K
334.62%
jan 1, 1993
1.3 mln
+170.0K
15.04%
jan 1, 1996
90.0K
-1.21 mln
-93.08%
jan 1, 1997
1.07 mln
+980.0K
1.09K%
jan 1, 1998
920.0K
-150.0K
-14.02%
jan 1, 1999
1.66 mln
+740.0K
80.43%
jan 1, 2000
540.0K
-1.12 mln
-67.47%
jan 1, 2001
3.46 mln
+2.92 mln
540.74%
jan 1, 2002
3.81 mln
+350.0K
10.12%
jan 1, 2003
3.94 mln
+130.0K
3.41%
jan 1, 2004
5.17 mln
+1.23 mln
31.22%
jan 1, 2005
3.83 mln
-1.34 mln
-25.92%
Ranking of countries by current statistics by years
