30
/
AIzaSyAYiBZKx7MnpbEhh9jyipgxe19OcubqV5w
April 1, 2024
111263
Congo, Rep.
COG
true
2
1
Net bilateral aid flows from DAC donors, Denmark (current US$)
2014,2013,2012,2011,2010,2001,1998,1986,1985,1984,1983,1982,1978,1977,1976,1975,1973,1968
Download
Global statistics library →Congo, Rep. →

Net bilateral aid flows from DAC donors, Denmark (current US$)

This statistics in other country:

AfghanistanAlbaniaAlgeriaAngolaArab WorldArgentinaArmeniaAzerbaijanBahrainBangladeshBelarusBelizeBeninBhutanBoliviaBosnia and HerzegovinaBotswanaBrazilBulgariaBurkina FasoBurundiCabo VerdeCambodiaCameroonCaribbean small statesCentral African RepublicCentral Europe and the BalticsChadChileChinaColombiaComorosCongo, Dem. Rep.Congo, Rep.Costa RicaCote d'IvoireCroatiaCubaCyprusCzech RepublicDjiboutiDominicaDominican RepublicEast Asia & PacificEast Asia & Pacific (excluding high income)East Asia & Pacific (IDA & IBRD countries)EcuadorEgypt, Arab Rep.El SalvadorEritreaEstoniaEthiopiaEuro areaEurope & Central AsiaEurope & Central Asia (excluding high income)Europe & Central Asia (IDA & IBRD countries)European UnionFijiFragile and conflict affected situationsGambia, TheGeorgiaGhanaGrenadaGuatemalaGuineaGuinea-BissauGuyanaHaitiHeavily indebted poor countries (HIPC)High incomeHondurasHungaryIBRD onlyIDA & IBRD totalIDA blendIDA onlyIDA totalIndiaIndonesiaIran, Islamic Rep.IraqIsraelJamaicaJordanKazakhstanKenyaKorea, Dem. People’s Rep.Korea, Rep.KosovoKuwaitKyrgyz RepublicLao PDRLatin America & Caribbean Latin America & Caribbean (excluding high income)Latin America & the Caribbean (IDA & IBRD countries)LatviaLeast developed countries: UN classificationLebanonLesothoLiberiaLibyaLithuaniaLow & middle incomeLow incomeLower middle incomeMacedonia, FYRMadagascarMalawiMalaysiaMaldivesMaliMaltaMauritaniaMauritiusMexicoMiddle East & North AfricaMiddle East & North Africa (excluding high income)Middle East & North Africa (IDA & IBRD countries)Middle incomeMoldovaMongoliaMontenegroMoroccoMozambiqueMyanmarNamibiaNepalNicaraguaNigerNigeriaOECD membersOmanOther small statesPacific island small statesPakistanPanamaPapua New GuineaParaguayPeruPhilippinesPolandRomaniaRussian FederationRwandaSamoaSenegalSerbiaSeychellesSierra LeoneSingaporeSlovak RepublicSloveniaSmall statesSolomon IslandsSomaliaSouth AfricaSouth AsiaSouth Asia (IDA & IBRD)South SudanSri LankaSub-Saharan Africa Sub-Saharan Africa (excluding high income)Sub-Saharan Africa (IDA & IBRD countries)SudanSwazilandSyrian Arab RepublicTajikistanTanzaniaThailandTimor-LesteTogoTongaTrinidad and TobagoTunisiaTurkeyTurkmenistanUgandaUkraineUpper middle incomeUruguayUzbekistanVanuatuVenezuela, RBVietnamWest Bank and GazaWorldYemen, Rep.ZambiaZimbabwe

Timeline:

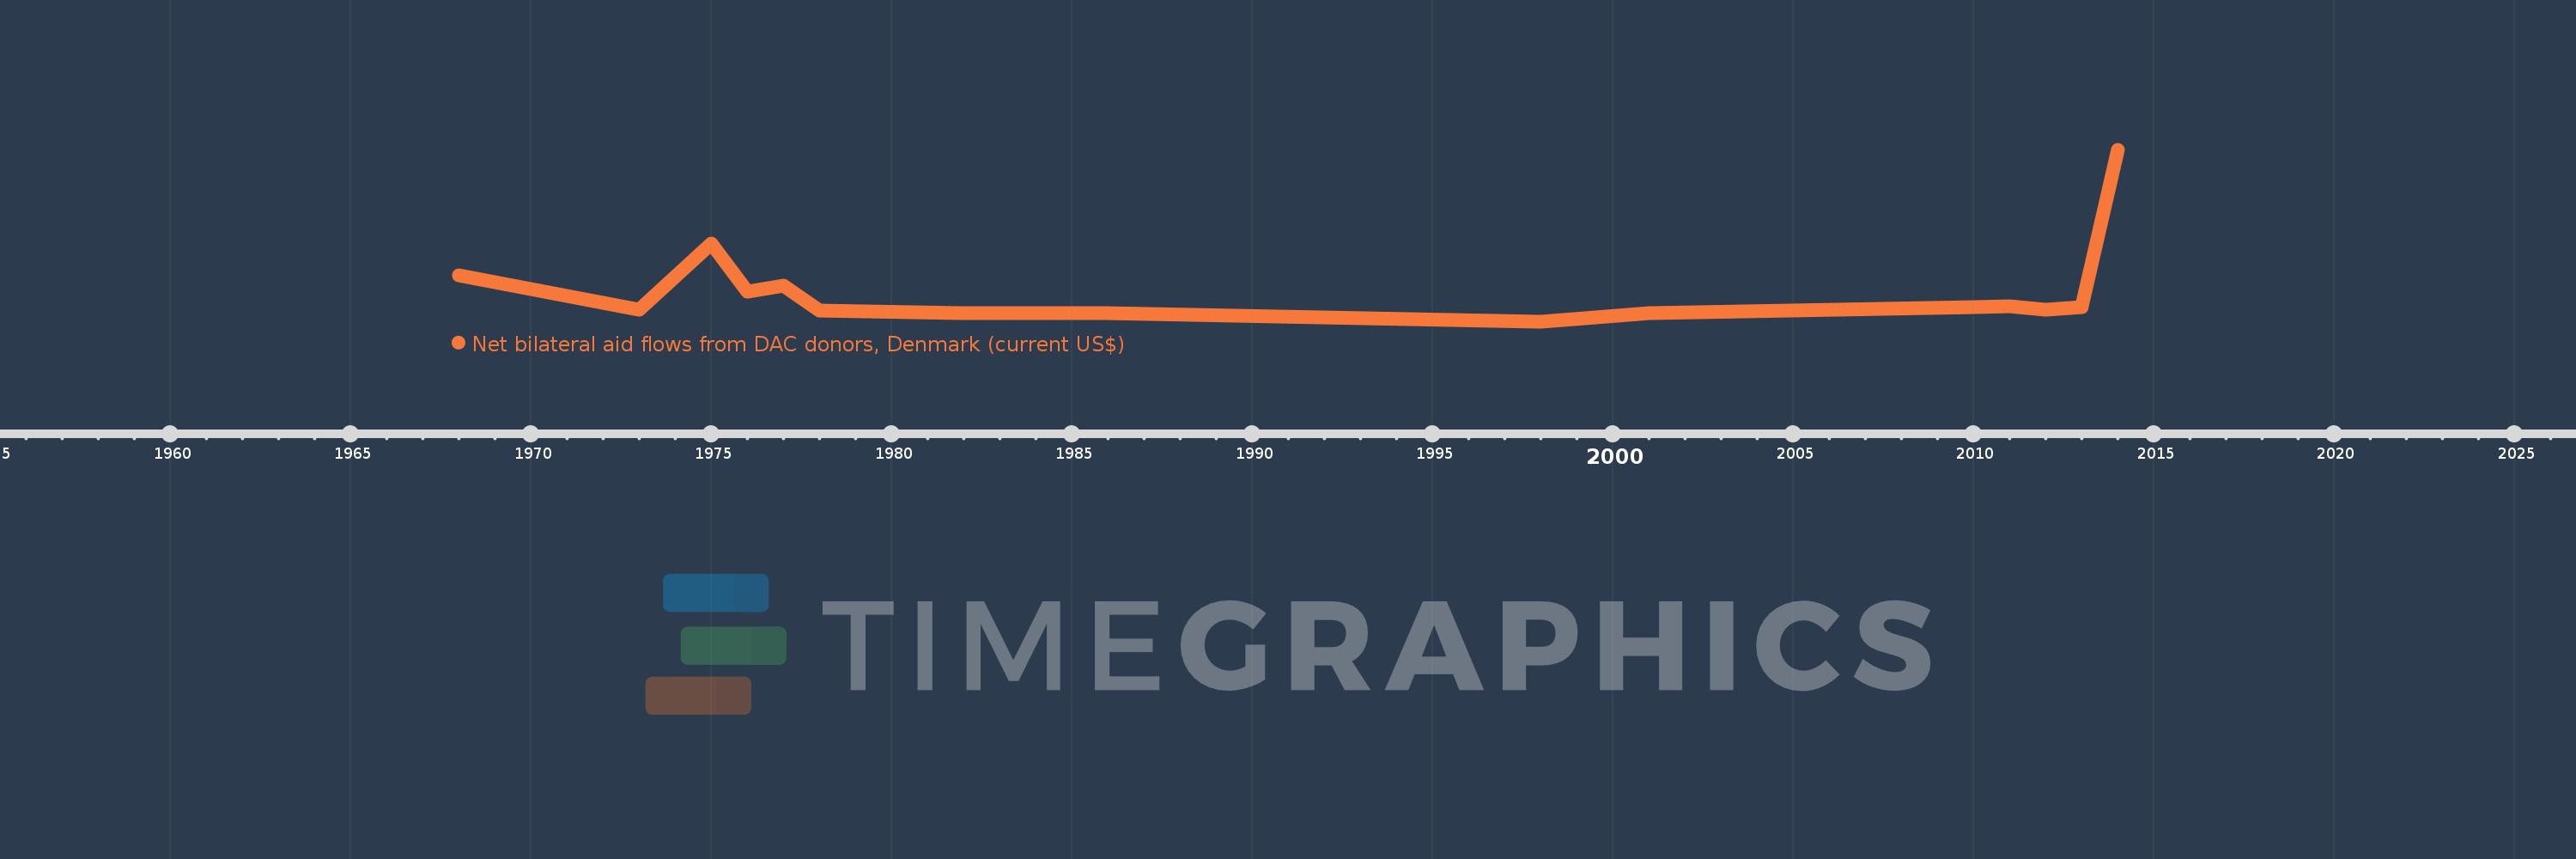
This timeline shows a graph from 1968 to 2014 of Congo, Rep.. No data until 1967. Number of actual observations by date: 18.

Source name:

World Development Indicators

Source organization:

Development Assistance Committee of the Organisation for Economic Co-operation and Development, Geographical Distribution of Financial Flows to Developing Countries, Development Co-operation Report, and International Development Statistics database. Data are available online at: www.oecd.org/dac/stats/idsonline.

Categories, topics:

Aid Effectiveness

Last updated:

apr 23, 2017

Indicators value changes by year

Meaning:
365.0K
Minimum:
-250.0K
jan 1, 1998
Maximum:
3.56 mln
jan 1, 2014
At the date of observation
Value
Absolute change
Change from the previous value
jan 1, 1968
790.0K
+790.0K
0.0%
jan 1, 1973
20.0K
-770.0K
-97.47%
jan 1, 1975
1.49 mln
+1.47 mln
7.35K%
jan 1, 1976
420.0K
-1.07 mln
-71.81%
jan 1, 1977
560.0K
+140.0K
33.33%
jan 1, 1978
10.0K
-550.0K
-98.21%
jan 1, 1982
-50.0K
-60.0K
-600.0%
jan 1, 1983
-50.0K
0.0
0.0%
jan 1, 1984
-60.0K
-10.0K
20.0%
jan 1, 1985
-50.0K
+10.0K
-16.67%
jan 1, 1986
-50.0K
0.0
0.0%
jan 1, 1998
-250.0K
-200.0K
400.0%
jan 1, 2001
-50.0K
+200.0K
-80.0%
jan 1, 2010
80.0K
+130.0K
-260.0%
jan 1, 2011
100.0K
+20.0K
25.0%
jan 1, 2012
20.0K
-80.0K
-80.0%
jan 1, 2013
80.0K
+60.0K
300.0%
jan 1, 2014
3.56 mln
+3.48 mln
4.35K%

Ranking of countries by current statistics by years