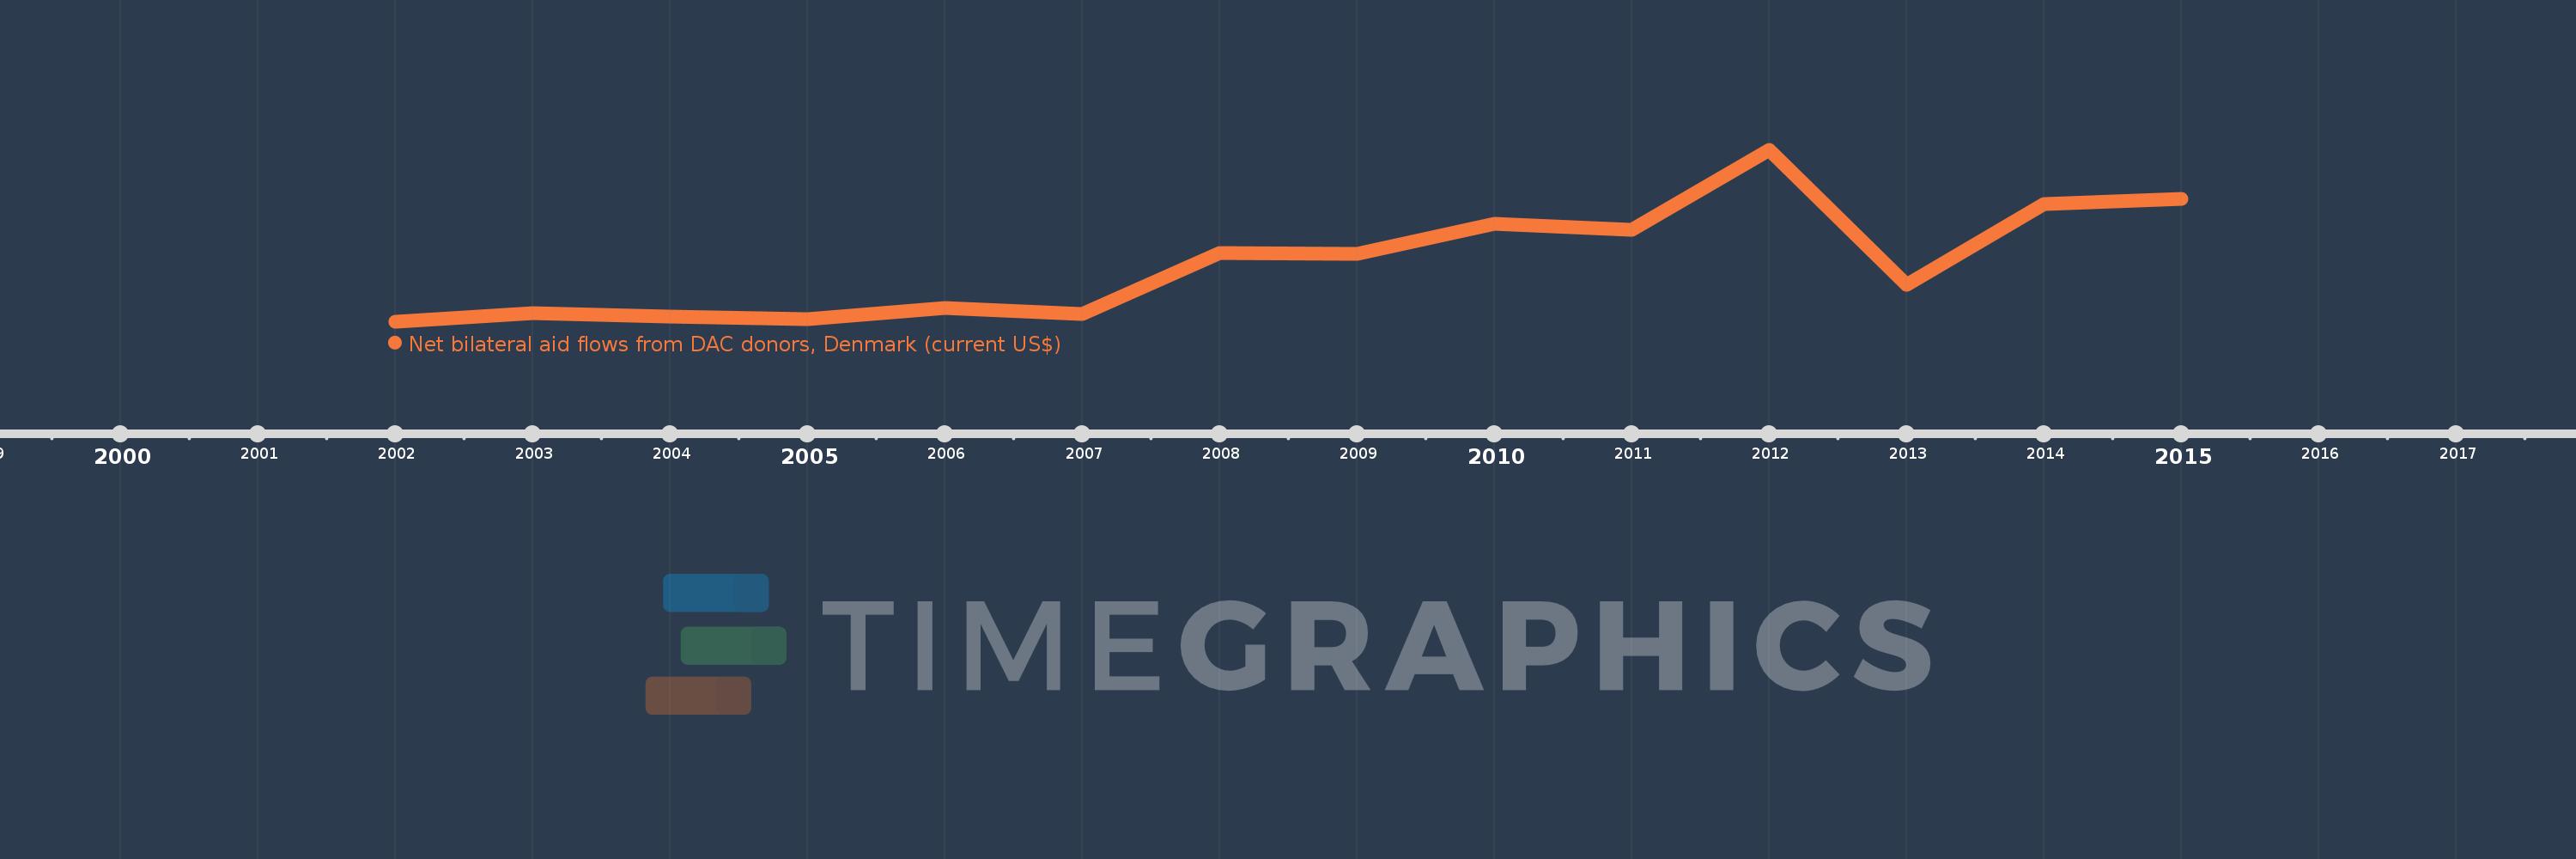
This timeline shows a graph from 2002 to 2015 of Georgia. No data until 2001. Number of actual observations by date: 14.
Source name:
World Development Indicators
Source organization:
Development Assistance Committee of the Organisation for Economic Co-operation and Development, Geographical Distribution of Financial Flows to Developing Countries, Development Co-operation Report, and International Development Statistics database. Data are available online at: www.oecd.org/dac/stats/idsonline.
Categories, topics:
Aid Effectiveness
Last updated:
apr 23, 2017
Indicators value changes by year
Meaning:
1.594 mln
Minimum:
80.0K
jan 1, 2002
Maximum:
4.54 mln
jan 1, 2012
At the date of observation
Value
Absolute change
Change from the previous value
jan 1, 2002
80.0K
+80.0K
0.0%
jan 1, 2003
320.0K
+240.0K
300.0%
jan 1, 2004
210.0K
-110.0K
-34.38%
jan 1, 2005
150.0K
-60.0K
-28.57%
jan 1, 2006
440.0K
+290.0K
193.33%
jan 1, 2007
280.0K
-160.0K
-36.36%
jan 1, 2008
1.88 mln
+1.6 mln
571.43%
jan 1, 2009
1.84 mln
-40.0K
-2.13%
jan 1, 2010
2.62 mln
+780.0K
42.39%
jan 1, 2011
2.48 mln
-140.0K
-5.34%
jan 1, 2012
4.54 mln
+2.06 mln
83.06%
jan 1, 2013
1.05 mln
-3.49 mln
-76.87%
jan 1, 2014
3.15 mln
+2.1 mln
200.0%
jan 1, 2015
3.27 mln
+120.0K
3.81%
Ranking of countries by current statistics by years
