29
/
en
AIzaSyAYiBZKx7MnpbEhh9jyipgxe19OcubqV5w
April 1, 2024
112589
Costa Rica
CRI
true
2
1
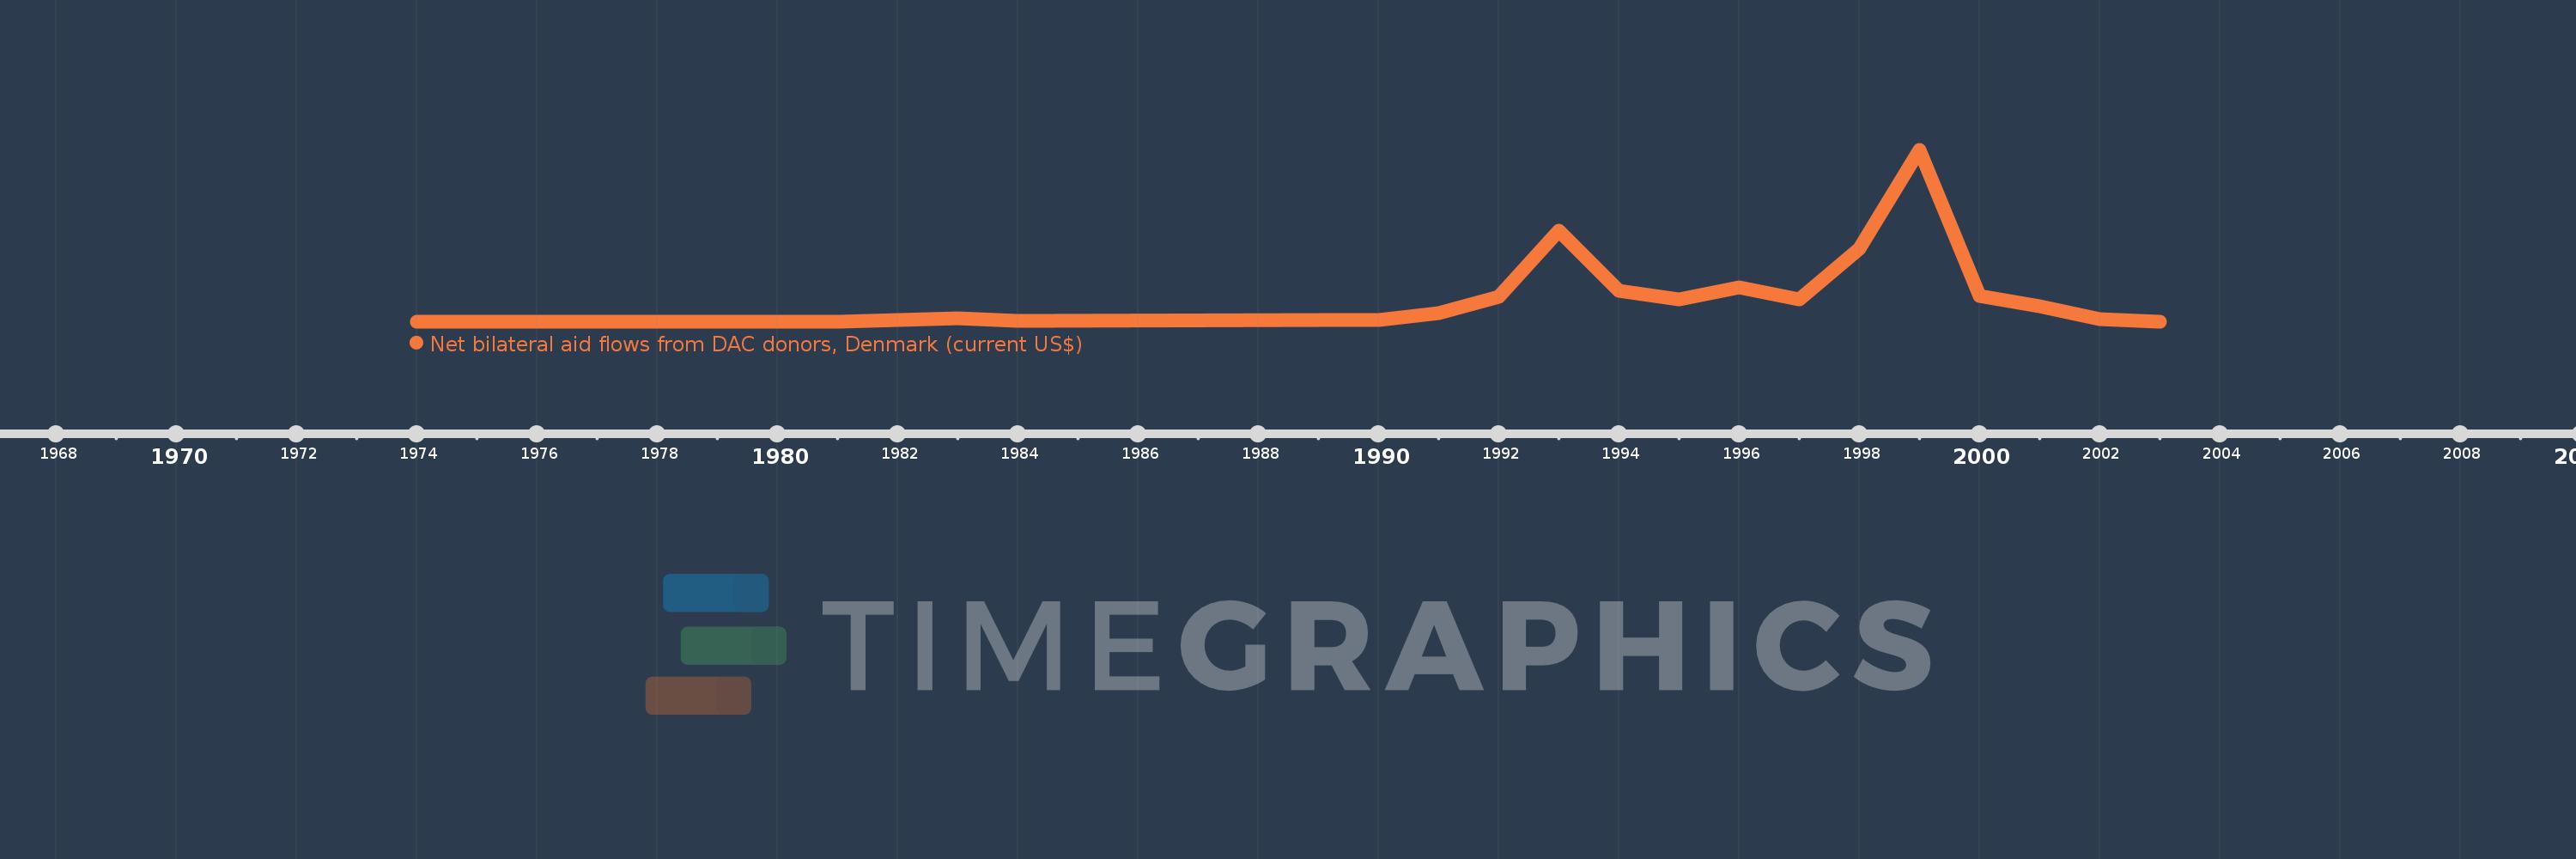
Net bilateral aid flows from DAC donors, Denmark (current US$)
2003,2002,2001,2000,1999,1998,1997,1996,1995,1994,1993,1992,1991,1990,1989,1984,1983,1981,1977,1976,1975,1974
This statistics in other country:
AfghanistanAlbaniaAlgeriaAngolaArab WorldArgentinaArmeniaAzerbaijanBahrainBangladeshBelarusBelizeBeninBhutanBoliviaBosnia and HerzegovinaBotswanaBrazilBulgariaBurkina FasoBurundiCabo VerdeCambodiaCameroonCaribbean small statesCentral African RepublicCentral Europe and the BalticsChadChileChinaColombiaComorosCongo, Dem. Rep.Congo, Rep.Costa RicaCote d'IvoireCroatiaCubaCyprusCzech RepublicDjiboutiDominicaDominican RepublicEast Asia & PacificEast Asia & Pacific (excluding high income)East Asia & Pacific (IDA & IBRD countries)EcuadorEgypt, Arab Rep.El SalvadorEritreaEstoniaEthiopiaEuro areaEurope & Central AsiaEurope & Central Asia (excluding high income)Europe & Central Asia (IDA & IBRD countries)European UnionFijiFragile and conflict affected situationsGambia, TheGeorgiaGhanaGrenadaGuatemalaGuineaGuinea-BissauGuyanaHaitiHeavily indebted poor countries (HIPC)High incomeHondurasHungaryIBRD onlyIDA & IBRD totalIDA blendIDA onlyIDA totalIndiaIndonesiaIran, Islamic Rep.IraqIsraelJamaicaJordanKazakhstanKenyaKorea, Dem. People’s Rep.Korea, Rep.KosovoKuwaitKyrgyz RepublicLao PDRLatin America & Caribbean Latin America & Caribbean (excluding high income)Latin America & the Caribbean (IDA & IBRD countries)LatviaLeast developed countries: UN classificationLebanonLesothoLiberiaLibyaLithuaniaLow & middle incomeLow incomeLower middle incomeMacedonia, FYRMadagascarMalawiMalaysiaMaldivesMaliMaltaMauritaniaMauritiusMexicoMiddle East & North AfricaMiddle East & North Africa (excluding high income)Middle East & North Africa (IDA & IBRD countries)Middle incomeMoldovaMongoliaMontenegroMoroccoMozambiqueMyanmarNamibiaNepalNicaraguaNigerNigeriaOECD membersOmanOther small statesPacific island small statesPakistanPanamaPapua New GuineaParaguayPeruPhilippinesPolandRomaniaRussian FederationRwandaSamoaSenegalSerbiaSeychellesSierra LeoneSingaporeSlovak RepublicSloveniaSmall statesSolomon IslandsSomaliaSouth AfricaSouth AsiaSouth Asia (IDA & IBRD)South SudanSri LankaSub-Saharan Africa Sub-Saharan Africa (excluding high income)Sub-Saharan Africa (IDA & IBRD countries)SudanSwazilandSyrian Arab RepublicTajikistanTanzaniaThailandTimor-LesteTogoTongaTrinidad and TobagoTunisiaTurkeyTurkmenistanUgandaUkraineUpper middle incomeUruguayUzbekistanVanuatuVenezuela, RBVietnamWest Bank and GazaWorldYemen, Rep.ZambiaZimbabwe Timeline:
This timeline shows a graph from 1974 to 2003 of Costa Rica. No data until 1973. Number of actual observations by date: 22.
Source name:
World Development Indicators
Source organization:
Development Assistance Committee of the Organisation for Economic Co-operation and Development, Geographical Distribution of Financial Flows to Developing Countries, Development Co-operation Report, and International Development Statistics database. Data are available online at: www.oecd.org/dac/stats/idsonline.
Categories, topics:
Aid Effectiveness
Last updated:
apr 23, 2017
Indicators value changes by year
Maximum:
7.68 mln
jan 1, 1999
At the date of observation
Value
Absolute change
Change from previous value
jan 1, 1974
10.0K
+10.0K
0.0%
jan 1, 1975
10.0K
0.0
0.0%
jan 1, 1976
30.0K
+20.0K
200.0%
jan 1, 1977
10.0K
-20.0K
-66.67%
jan 1, 1981
10.0K
0.0
0.0%
jan 1, 1983
160.0K
+150.0K
1.5K%
jan 1, 1984
50.0K
-110.0K
-68.75%
jan 1, 1989
100.0K
+50.0K
100.0%
jan 1, 1990
90.0K
-10.0K
-10.0%
jan 1, 1991
420.0K
+330.0K
366.67%
jan 1, 1992
1.14 mln
+720.0K
171.43%
jan 1, 1993
4.1 mln
+2.96 mln
259.65%
jan 1, 1994
1.4 mln
-2.7 mln
-65.85%
jan 1, 1995
1000.0K
-400.0K
-28.57%
jan 1, 1996
1.57 mln
+570.0K
57.0%
jan 1, 1997
1.03 mln
-540.0K
-34.39%
jan 1, 1998
3.28 mln
+2.25 mln
218.45%
jan 1, 1999
7.68 mln
+4.4 mln
134.15%
jan 1, 2000
1.19 mln
-6.49 mln
-84.51%
jan 1, 2001
720.0K
-470.0K
-39.5%
jan 1, 2002
150.0K
-570.0K
-79.17%
jan 1, 2003
30.0K
-120.0K
-80.0%
Ranking of countries by current statistics by years


Comments: