29
/
en
AIzaSyAYiBZKx7MnpbEhh9jyipgxe19OcubqV5w
April 1, 2024
170246
Korea, Rep.
KOR
true
2
1
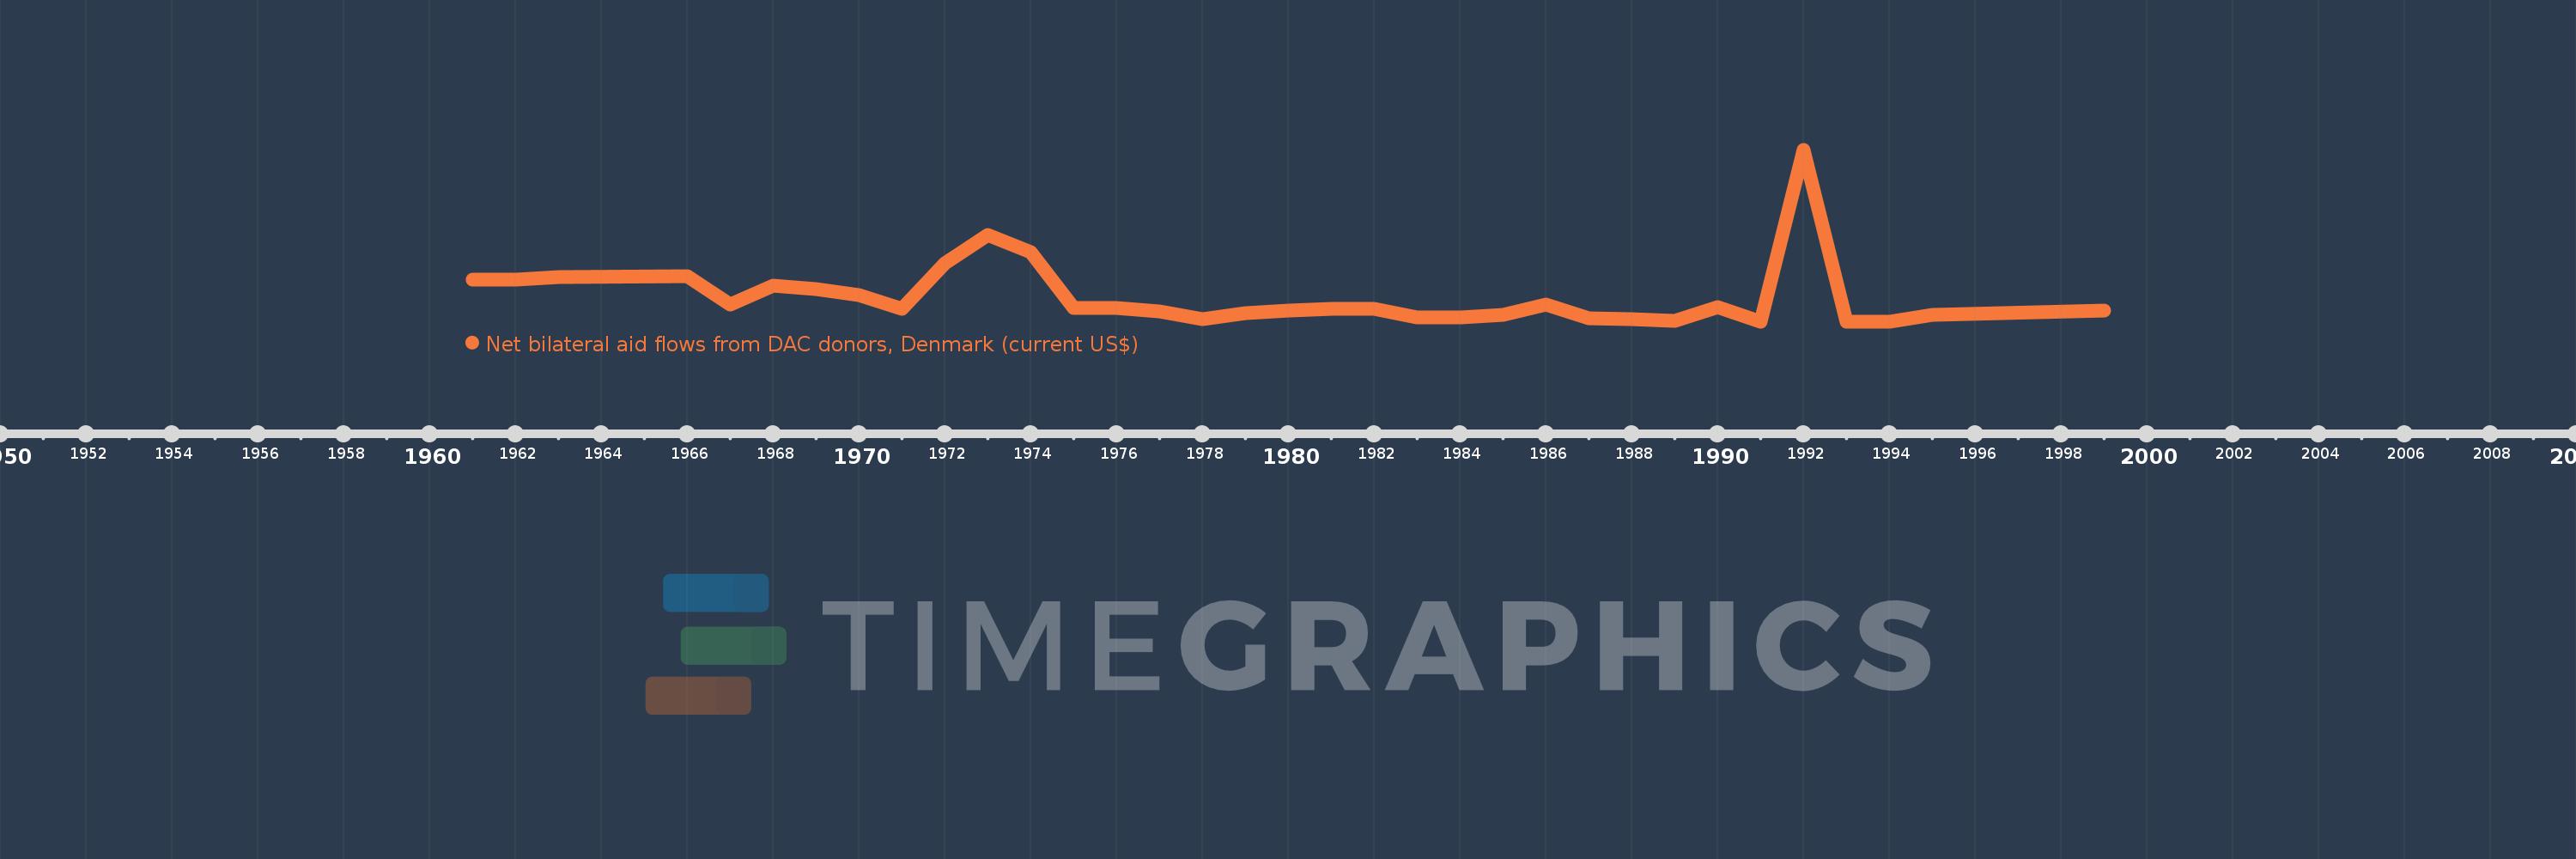
Net bilateral aid flows from DAC donors, Denmark (current US$)
1999,1995,1994,1993,1992,1991,1990,1989,1988,1987,1986,1985,1984,1983,1982,1981,1980,1979,1978,1977,1976,1975,1974,1973,1972,1971,1970,1969,1968,1967,1966,1963,1962,1961
This statistics in other country:
AfghanistanAlbaniaAlgeriaAngolaArab WorldArgentinaArmeniaAzerbaijanBahrainBangladeshBelarusBelizeBeninBhutanBoliviaBosnia and HerzegovinaBotswanaBrazilBulgariaBurkina FasoBurundiCabo VerdeCambodiaCameroonCaribbean small statesCentral African RepublicCentral Europe and the BalticsChadChileChinaColombiaComorosCongo, Dem. Rep.Congo, Rep.Costa RicaCote d'IvoireCroatiaCubaCyprusCzech RepublicDjiboutiDominicaDominican RepublicEast Asia & PacificEast Asia & Pacific (excluding high income)East Asia & Pacific (IDA & IBRD countries)EcuadorEgypt, Arab Rep.El SalvadorEritreaEstoniaEthiopiaEuro areaEurope & Central AsiaEurope & Central Asia (excluding high income)Europe & Central Asia (IDA & IBRD countries)European UnionFijiFragile and conflict affected situationsGambia, TheGeorgiaGhanaGrenadaGuatemalaGuineaGuinea-BissauGuyanaHaitiHeavily indebted poor countries (HIPC)High incomeHondurasHungaryIBRD onlyIDA & IBRD totalIDA blendIDA onlyIDA totalIndiaIndonesiaIran, Islamic Rep.IraqIsraelJamaicaJordanKazakhstanKenyaKorea, Dem. People’s Rep.Korea, Rep.KosovoKuwaitKyrgyz RepublicLao PDRLatin America & Caribbean Latin America & Caribbean (excluding high income)Latin America & the Caribbean (IDA & IBRD countries)LatviaLeast developed countries: UN classificationLebanonLesothoLiberiaLibyaLithuaniaLow & middle incomeLow incomeLower middle incomeMacedonia, FYRMadagascarMalawiMalaysiaMaldivesMaliMaltaMauritaniaMauritiusMexicoMiddle East & North AfricaMiddle East & North Africa (excluding high income)Middle East & North Africa (IDA & IBRD countries)Middle incomeMoldovaMongoliaMontenegroMoroccoMozambiqueMyanmarNamibiaNepalNicaraguaNigerNigeriaOECD membersOmanOther small statesPacific island small statesPakistanPanamaPapua New GuineaParaguayPeruPhilippinesPolandRomaniaRussian FederationRwandaSamoaSenegalSerbiaSeychellesSierra LeoneSingaporeSlovak RepublicSloveniaSmall statesSolomon IslandsSomaliaSouth AfricaSouth AsiaSouth Asia (IDA & IBRD)South SudanSri LankaSub-Saharan Africa Sub-Saharan Africa (excluding high income)Sub-Saharan Africa (IDA & IBRD countries)SudanSwazilandSyrian Arab RepublicTajikistanTanzaniaThailandTimor-LesteTogoTongaTrinidad and TobagoTunisiaTurkeyTurkmenistanUgandaUkraineUpper middle incomeUruguayUzbekistanVanuatuVenezuela, RBVietnamWest Bank and GazaWorldYemen, Rep.ZambiaZimbabwe Timeline:
This timeline shows a graph from 1961 to 1999 of Korea, Rep.. No data until 1960. Number of actual observations by date: 34.
Source name:
World Development Indicators
Source organization:
Development Assistance Committee of the Organisation for Economic Co-operation and Development, Geographical Distribution of Financial Flows to Developing Countries, Development Co-operation Report, and International Development Statistics database. Data are available online at: www.oecd.org/dac/stats/idsonline.
Categories, topics:
Aid Effectiveness
Last updated:
apr 23, 2017
Indicators value changes by year
Minimum:
-180.0K
jan 1, 1991
Maximum:
2.64 mln
jan 1, 1992
At the date of observation
Value
Absolute change
Change from previous value
jan 1, 1961
520.0K
+520.0K
0.0%
jan 1, 1962
510.0K
-10.0K
-1.92%
jan 1, 1963
560.0K
+50.0K
9.8%
jan 1, 1966
570.0K
+10.0K
1.79%
jan 1, 1967
110.0K
-460.0K
-80.7%
jan 1, 1968
420.0K
+310.0K
281.82%
jan 1, 1969
360.0K
-60.0K
-14.29%
jan 1, 1970
260.0K
-100.0K
-27.78%
jan 1, 1971
30.0K
-230.0K
-88.46%
jan 1, 1972
790.0K
+760.0K
2.53K%
jan 1, 1973
1.25 mln
+460.0K
58.23%
jan 1, 1974
960.0K
-290.0K
-23.2%
jan 1, 1975
50.0K
-910.0K
-94.79%
jan 1, 1976
50.0K
0.0
0.0%
jan 1, 1977
-10.0K
-60.0K
-120.0%
jan 1, 1978
-140.0K
-130.0K
1.3K%
jan 1, 1979
-40.0K
+100.0K
-71.43%
jan 1, 1980
10.0K
+50.0K
-125.0%
jan 1, 1981
40.0K
+30.0K
300.0%
jan 1, 1982
30.0K
-10.0K
-25.0%
jan 1, 1983
-100.0K
-130.0K
-433.33%
jan 1, 1984
-110.0K
-10.0K
10.0%
jan 1, 1985
-70.0K
+40.0K
-36.36%
jan 1, 1986
100.0K
+170.0K
-242.86%
jan 1, 1987
-120.0K
-220.0K
-220.0%
jan 1, 1988
-140.0K
-20.0K
16.67%
jan 1, 1989
-160.0K
-20.0K
14.29%
jan 1, 1990
70.0K
+230.0K
-143.75%
jan 1, 1991
-180.0K
-250.0K
-357.14%
jan 1, 1992
2.64 mln
+2.82 mln
-1.57K%
jan 1, 1993
-180.0K
-2.82 mln
-106.82%
jan 1, 1994
-170.0K
+10.0K
-5.56%
jan 1, 1995
-70.0K
+100.0K
-58.82%
jan 1, 1999
10.0K
+80.0K
-114.29%
Ranking of countries by current statistics by years


Comments: