29
/
en
AIzaSyAYiBZKx7MnpbEhh9jyipgxe19OcubqV5w
April 1, 2024
68426
Angola
AGO
true
2
1
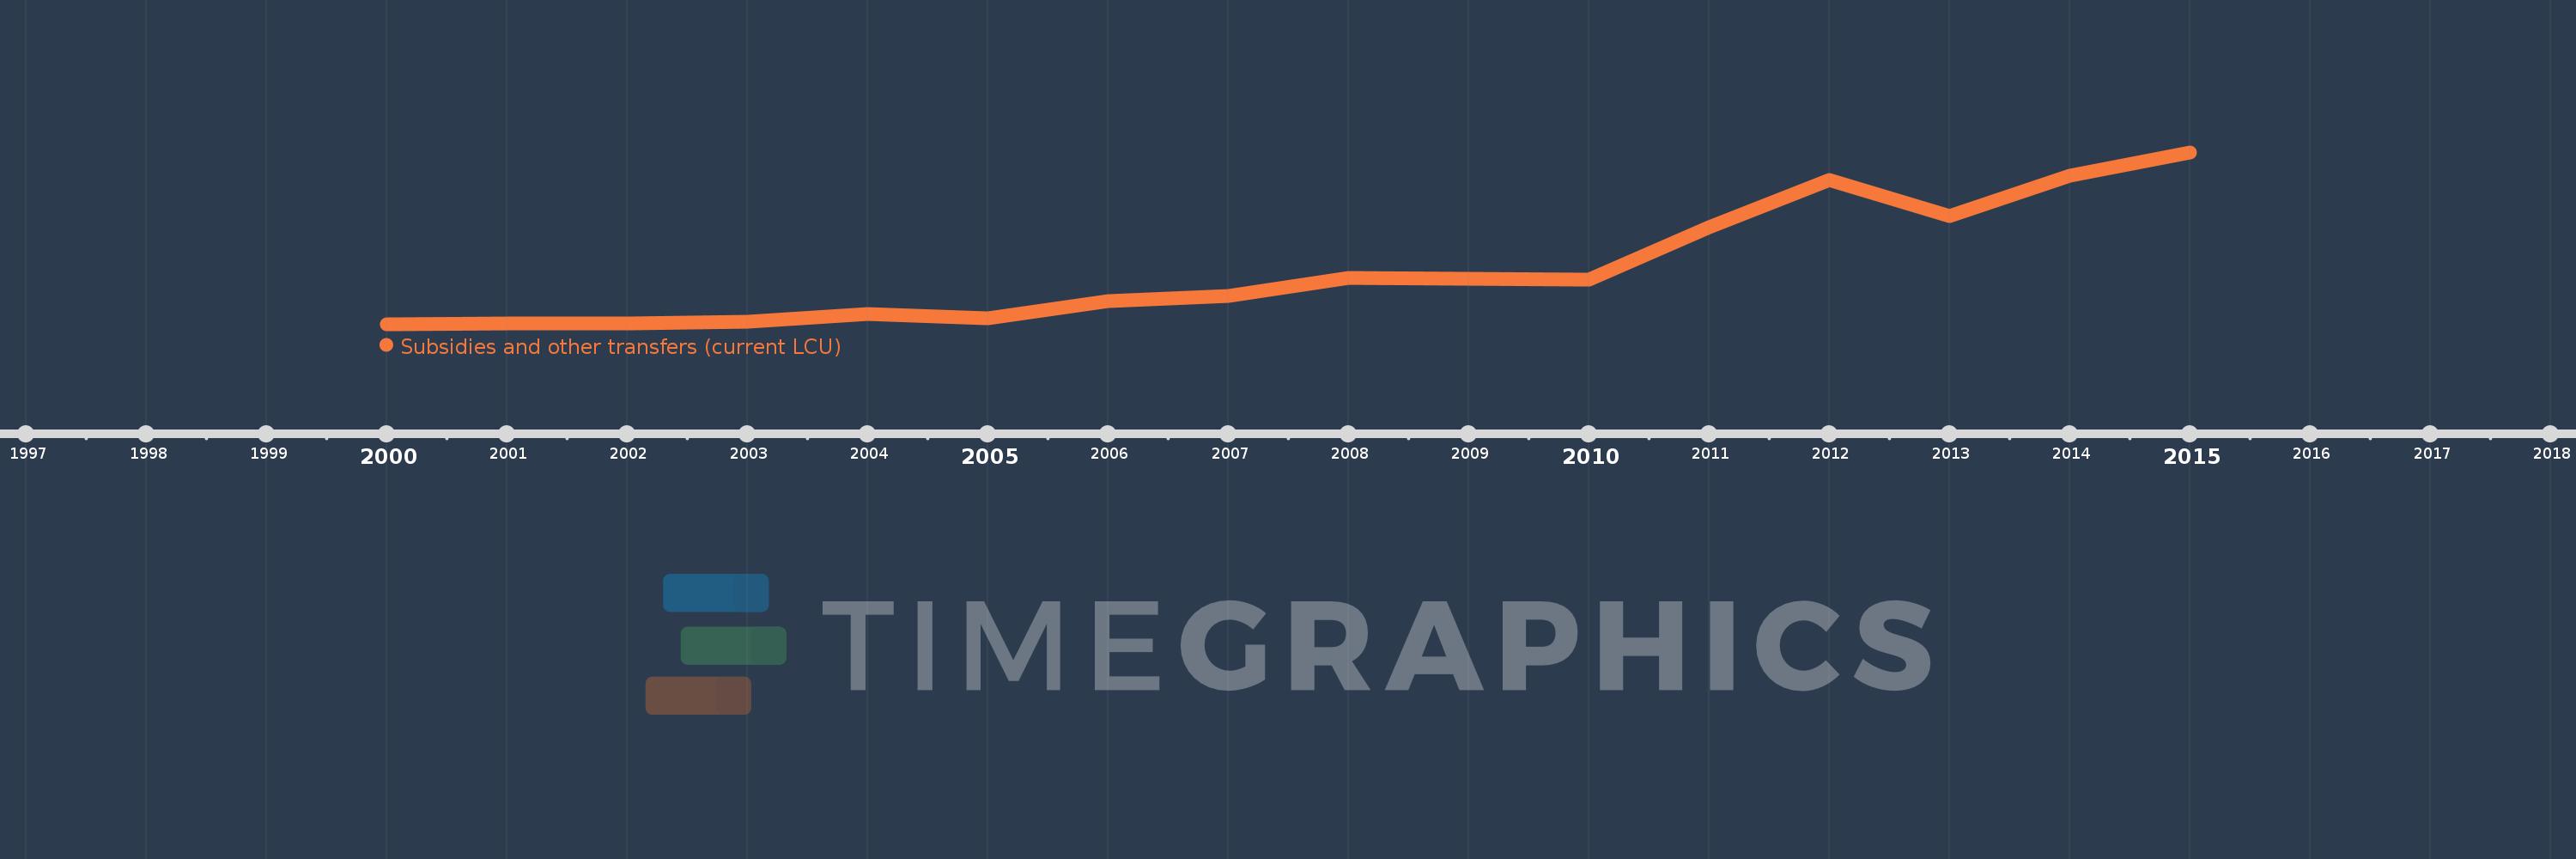
Subsidies and other transfers (current LCU)
2015,2014,2013,2012,2011,2010,2009,2008,2007,2006,2005,2004,2003,2002,2001,2000
This statistics in other country:
AfghanistanAlbaniaAlgeriaAngolaAntigua and BarbudaArmeniaAustraliaAustriaAzerbaijanBahamas, TheBahrainBangladeshBarbadosBelarusBelgiumBelizeBeninBhutanBoliviaBosnia and HerzegovinaBotswanaBrazilBulgariaBurkina FasoBurundiCabo VerdeCambodiaCanadaCentral African RepublicChileColombiaCongo, Dem. Rep.Congo, Rep.Costa RicaCote d'IvoireCroatiaCyprusCzech RepublicDenmarkDominicaDominican RepublicEgypt, Arab Rep.El SalvadorEquatorial GuineaEstoniaEthiopiaFijiFinlandFranceGambia, TheGeorgiaGermanyGhanaGreeceGrenadaGuatemalaHondurasHong Kong SAR, ChinaHungaryIcelandIndiaIndonesiaIran, Islamic Rep.IraqIrelandIsraelItalyJamaicaJapanJordanKazakhstanKenyaKiribatiKorea, Rep.KuwaitKyrgyz RepublicLao PDRLatviaLebanonLesothoLiberiaLithuaniaLuxembourgMacao SAR, ChinaMacedonia, FYRMadagascarMalawiMalaysiaMaldivesMaliMaltaMauritiusMicronesia, Fed. Sts.MoldovaMongoliaMoroccoMozambiqueNamibiaNepalNetherlandsNew ZealandNicaraguaNigeriaNorwayOmanPakistanPanamaPapua New GuineaParaguayPeruPhilippinesPolandPortugalQatarRomaniaRussian FederationRwandaSamoaSan MarinoSao Tome and PrincipeSenegalSerbiaSeychellesSierra LeoneSingaporeSlovak RepublicSloveniaSolomon IslandsSouth AfricaSpainSri LankaSt. Kitts and NevisSt. LuciaSurinameSwazilandSwedenSwitzerlandSyrian Arab RepublicTajikistanTanzaniaThailandTimor-LesteTogoTrinidad and TobagoTunisiaTurkeyUgandaUkraineUnited Arab EmiratesUnited KingdomUnited StatesUruguayVanuatuVenezuela, RBWest Bank and GazaYemen, Rep.ZambiaZimbabwe Timeline:
This timeline shows a graph from 2000 to 2015 of Angola. No data until 1999. Number of actual observations by date: 16.
Source name:
World Development Indicators
Source organization:
International Monetary Fund, Government Finance Statistics Yearbook and data files.
Categories, topics:
Public Sector
Last updated:
apr 23, 2017
Indicators value changes by year
Minimum:
678.988 mln
jan 1, 2000
Maximum:
1.068 trl
jan 1, 2015
At the date of observation
Value
Absolute change
Change from previous value
jan 1, 2000
678.988 mln
+678.988 mln
0.0%
jan 1, 2001
3.719 bln
+3.04 bln
447.67%
jan 1, 2002
6.956 bln
+3.237 bln
87.05%
jan 1, 2003
16.469 bln
+9.514 bln
136.78%
jan 1, 2004
65.469 bln
+49.0 bln
297.52%
jan 1, 2005
39.15 bln
-26.32 bln
-40.2%
jan 1, 2006
146.897 bln
+107.747 bln
275.22%
jan 1, 2007
178.131 bln
+31.235 bln
21.26%
jan 1, 2008
287.223 bln
+109.092 bln
61.24%
jan 1, 2009
284.869 bln
-2.355 bln
-0.82%
jan 1, 2010
277.728 bln
-7.141 bln
-2.51%
jan 1, 2011
602.315 bln
+324.587 bln
116.87%
jan 1, 2012
897.2 bln
+294.885 bln
48.96%
jan 1, 2013
670.324 bln
-226.876 bln
-25.29%
jan 1, 2014
923.631 bln
+253.307 bln
37.79%
jan 1, 2015
1.068 trl
+144.783 bln
15.68%
Ranking of countries by current statistics by years


Comments: