29
/
en
AIzaSyAYiBZKx7MnpbEhh9jyipgxe19OcubqV5w
April 1, 2024
255847
Swaziland
SWZ
true
2
1
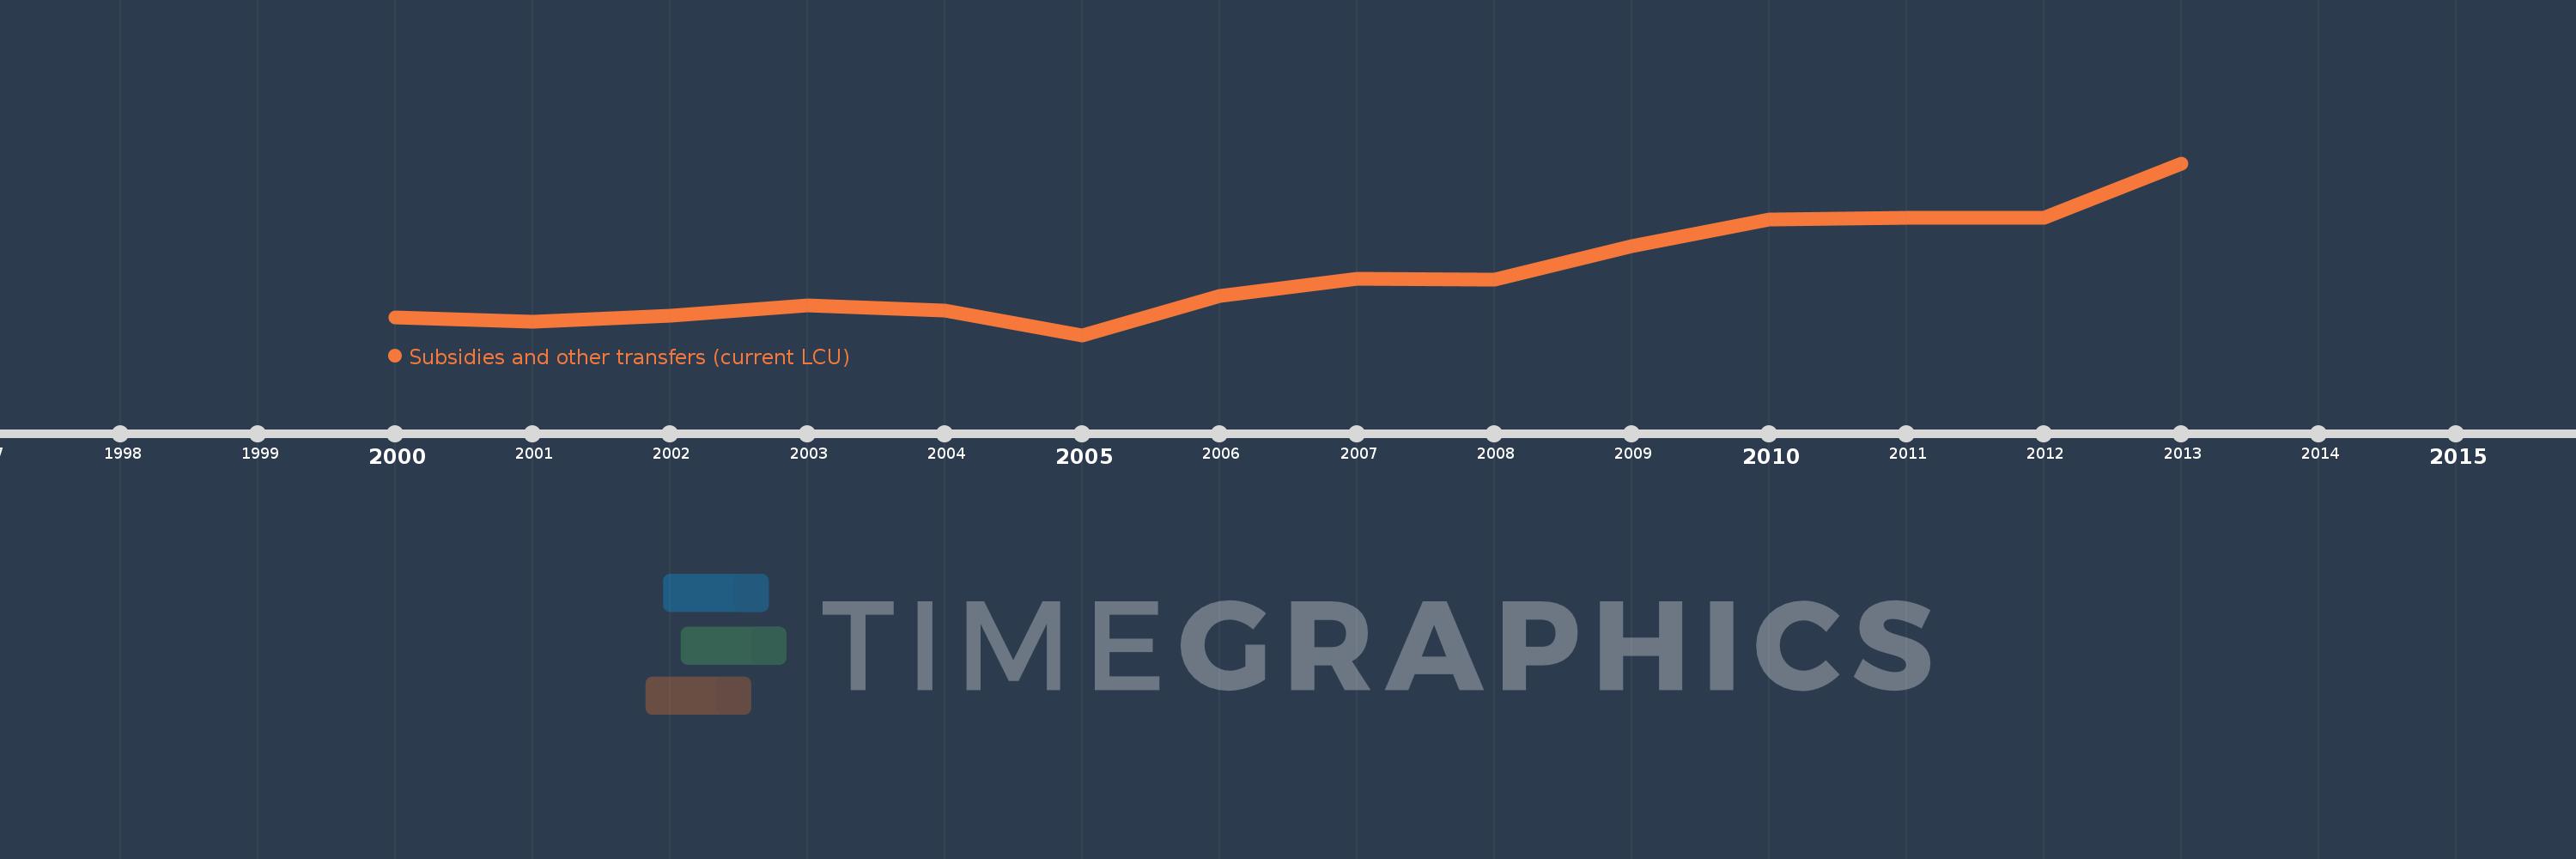
Subsidies and other transfers (current LCU)
2013,2012,2011,2010,2009,2008,2007,2006,2005,2004,2003,2002,2001,2000
This statistics in other country:
AfghanistanAlbaniaAlgeriaAngolaAntigua and BarbudaArmeniaAustraliaAustriaAzerbaijanBahamas, TheBahrainBangladeshBarbadosBelarusBelgiumBelizeBeninBhutanBoliviaBosnia and HerzegovinaBotswanaBrazilBulgariaBurkina FasoBurundiCabo VerdeCambodiaCanadaCentral African RepublicChileColombiaCongo, Dem. Rep.Congo, Rep.Costa RicaCote d'IvoireCroatiaCyprusCzech RepublicDenmarkDominicaDominican RepublicEgypt, Arab Rep.El SalvadorEquatorial GuineaEstoniaEthiopiaFijiFinlandFranceGambia, TheGeorgiaGermanyGhanaGreeceGrenadaGuatemalaHondurasHong Kong SAR, ChinaHungaryIcelandIndiaIndonesiaIran, Islamic Rep.IraqIrelandIsraelItalyJamaicaJapanJordanKazakhstanKenyaKiribatiKorea, Rep.KuwaitKyrgyz RepublicLao PDRLatviaLebanonLesothoLiberiaLithuaniaLuxembourgMacao SAR, ChinaMacedonia, FYRMadagascarMalawiMalaysiaMaldivesMaliMaltaMauritiusMicronesia, Fed. Sts.MoldovaMongoliaMoroccoMozambiqueNamibiaNepalNetherlandsNew ZealandNicaraguaNigeriaNorwayOmanPakistanPanamaPapua New GuineaParaguayPeruPhilippinesPolandPortugalQatarRomaniaRussian FederationRwandaSamoaSan MarinoSao Tome and PrincipeSenegalSerbiaSeychellesSierra LeoneSingaporeSlovak RepublicSloveniaSolomon IslandsSouth AfricaSpainSri LankaSt. Kitts and NevisSt. LuciaSurinameSwazilandSwedenSwitzerlandSyrian Arab RepublicTajikistanTanzaniaThailandTimor-LesteTogoTrinidad and TobagoTunisiaTurkeyUgandaUkraineUnited Arab EmiratesUnited KingdomUnited StatesUruguayVanuatuVenezuela, RBWest Bank and GazaYemen, Rep.ZambiaZimbabwe Timeline:
This timeline shows a graph from 2000 to 2013 of Swaziland. No data until 1999. Number of actual observations by date: 14.
Source name:
World Development Indicators
Source organization:
International Monetary Fund, Government Finance Statistics Yearbook and data files.
Categories, topics:
Public Sector
Last updated:
apr 23, 2017
Indicators value changes by year
Minimum:
256.839 mln
jan 1, 2005
Maximum:
2.325 bln
jan 1, 2013
At the date of observation
Value
Absolute change
Change from previous value
jan 1, 2000
470.7 mln
+470.7 mln
0.0%
jan 1, 2001
413.248 mln
-57.452 mln
-12.21%
jan 1, 2002
488.717 mln
+75.47 mln
18.26%
jan 1, 2003
610.434 mln
+121.717 mln
24.91%
jan 1, 2004
550.627 mln
-59.807 mln
-9.8%
jan 1, 2005
256.839 mln
-293.788 mln
-53.36%
jan 1, 2006
726.58 mln
+469.741 mln
182.89%
jan 1, 2007
929.355 mln
+202.775 mln
27.91%
jan 1, 2008
922.929 mln
-6.426 mln
-0.69%
jan 1, 2009
1.326 bln
+402.83 mln
43.65%
jan 1, 2010
1.651 bln
+325.315 mln
24.54%
jan 1, 2011
1.663 bln
+12.223 mln
0.74%
jan 1, 2012
1.667 bln
+3.288 mln
0.2%
jan 1, 2013
2.325 bln
+658.282 mln
39.5%
Ranking of countries by current statistics by years


Comments: