29
/
en
AIzaSyAYiBZKx7MnpbEhh9jyipgxe19OcubqV5w
April 1, 2024
224337
Philippines
PHL
true
2
1
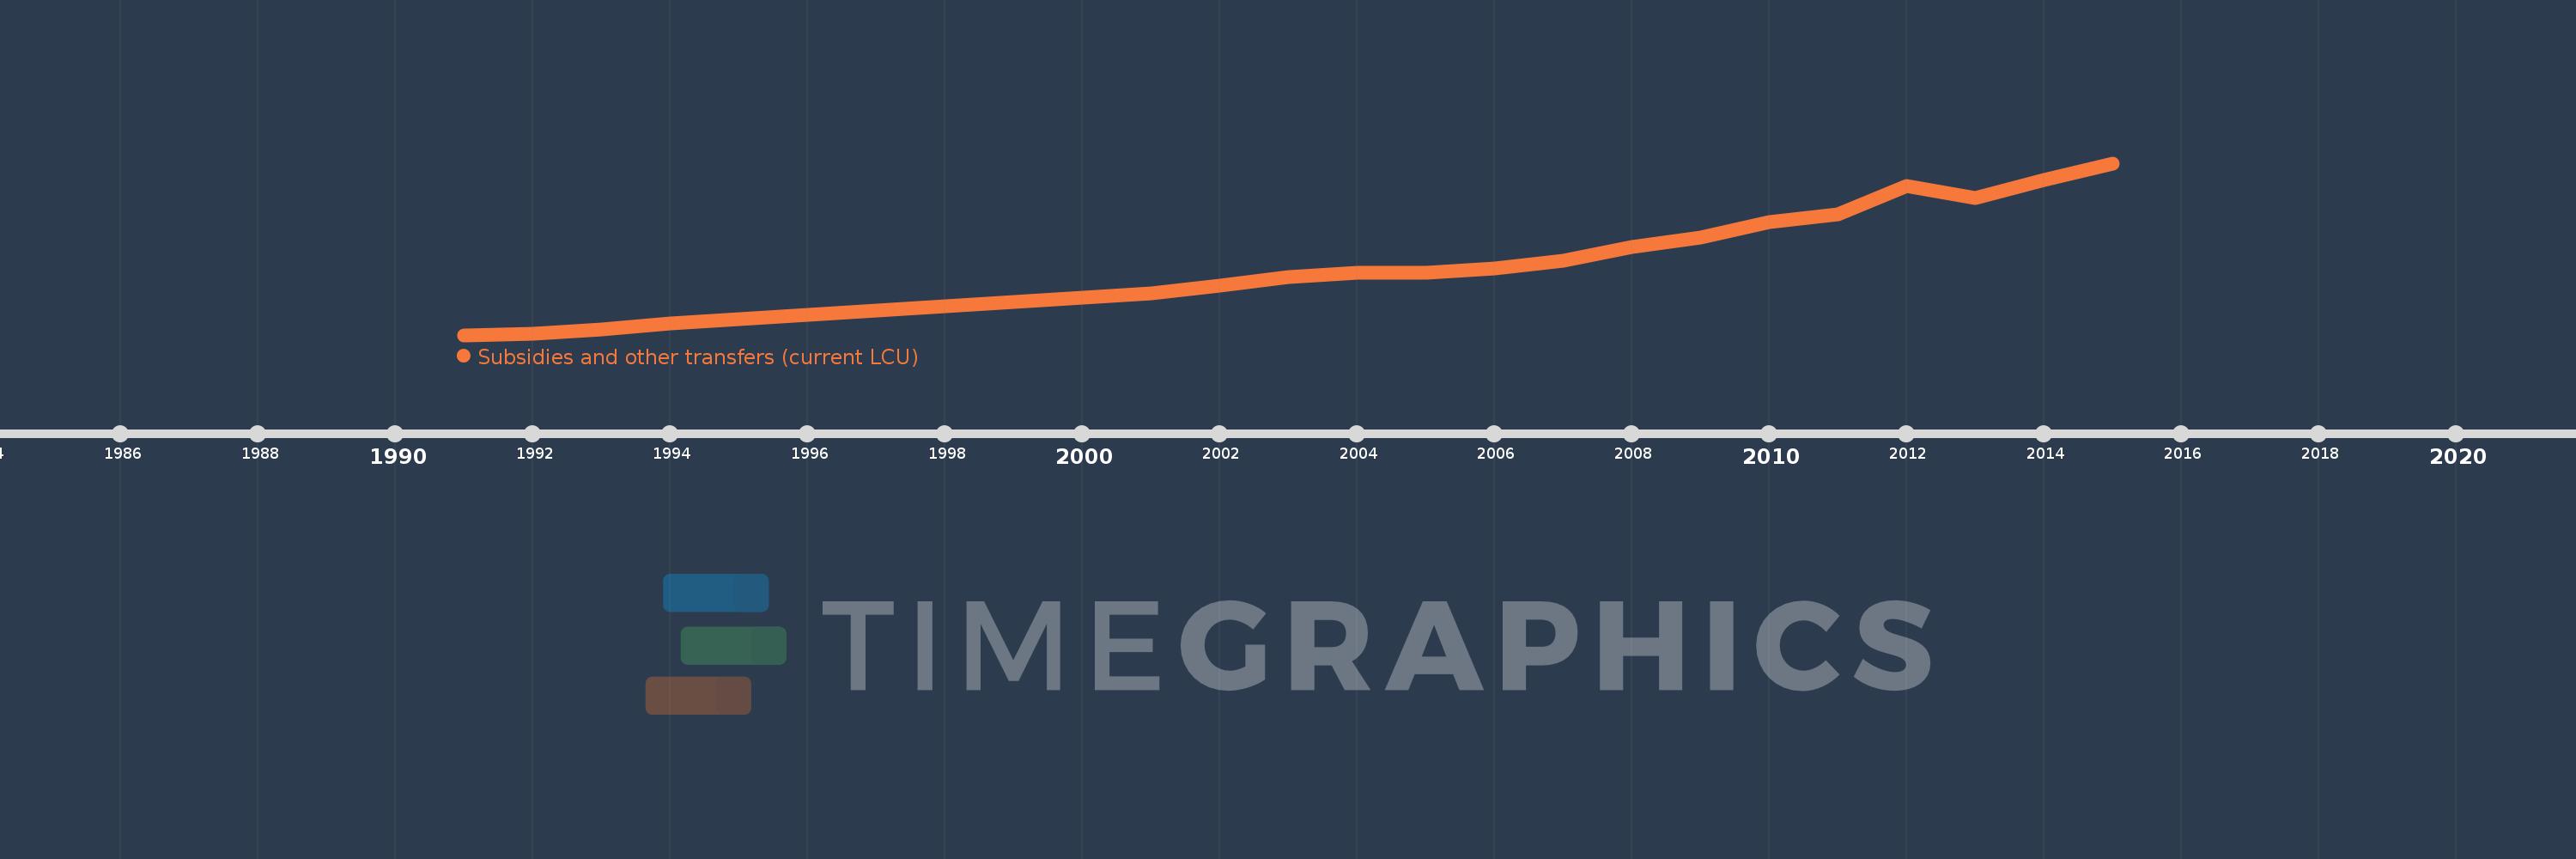
Subsidies and other transfers (current LCU)
2015,2014,2013,2012,2011,2010,2009,2008,2007,2006,2005,2004,2003,2002,2001,1994,1993,1992,1991
This statistics in other country:
AfghanistanAlbaniaAlgeriaAngolaAntigua and BarbudaArmeniaAustraliaAustriaAzerbaijanBahamas, TheBahrainBangladeshBarbadosBelarusBelgiumBelizeBeninBhutanBoliviaBosnia and HerzegovinaBotswanaBrazilBulgariaBurkina FasoBurundiCabo VerdeCambodiaCanadaCentral African RepublicChileColombiaCongo, Dem. Rep.Congo, Rep.Costa RicaCote d'IvoireCroatiaCyprusCzech RepublicDenmarkDominicaDominican RepublicEgypt, Arab Rep.El SalvadorEquatorial GuineaEstoniaEthiopiaFijiFinlandFranceGambia, TheGeorgiaGermanyGhanaGreeceGrenadaGuatemalaHondurasHong Kong SAR, ChinaHungaryIcelandIndiaIndonesiaIran, Islamic Rep.IraqIrelandIsraelItalyJamaicaJapanJordanKazakhstanKenyaKiribatiKorea, Rep.KuwaitKyrgyz RepublicLao PDRLatviaLebanonLesothoLiberiaLithuaniaLuxembourgMacao SAR, ChinaMacedonia, FYRMadagascarMalawiMalaysiaMaldivesMaliMaltaMauritiusMicronesia, Fed. Sts.MoldovaMongoliaMoroccoMozambiqueNamibiaNepalNetherlandsNew ZealandNicaraguaNigeriaNorwayOmanPakistanPanamaPapua New GuineaParaguayPeruPhilippinesPolandPortugalQatarRomaniaRussian FederationRwandaSamoaSan MarinoSao Tome and PrincipeSenegalSerbiaSeychellesSierra LeoneSingaporeSlovak RepublicSloveniaSolomon IslandsSouth AfricaSpainSri LankaSt. Kitts and NevisSt. LuciaSurinameSwazilandSwedenSwitzerlandSyrian Arab RepublicTajikistanTanzaniaThailandTimor-LesteTogoTrinidad and TobagoTunisiaTurkeyUgandaUkraineUnited Arab EmiratesUnited KingdomUnited StatesUruguayVanuatuVenezuela, RBWest Bank and GazaYemen, Rep.ZambiaZimbabwe Timeline:
This timeline shows a graph from 1991 to 2015 of Philippines. No data until 1990. Number of actual observations by date: 19.
Source name:
World Development Indicators
Source organization:
International Monetary Fund, Government Finance Statistics Yearbook and data files.
Categories, topics:
Public Sector
Last updated:
apr 23, 2017
Indicators value changes by year
Minimum:
7.31 bln
jan 1, 1991
Maximum:
424.675 bln
jan 1, 2015
At the date of observation
Value
Absolute change
Change from previous value
jan 1, 1991
7.31 bln
+7.31 bln
0.0%
jan 1, 1992
9.781 bln
+2.471 bln
33.8%
jan 1, 1993
20.175 bln
+10.394 bln
106.27%
jan 1, 1994
34.716 bln
+14.541 bln
72.07%
jan 1, 2001
108.9 bln
+74.184 bln
213.69%
jan 1, 2002
128.244 bln
+19.344 bln
17.76%
jan 1, 2003
148.1 bln
+19.856 bln
15.48%
jan 1, 2004
159.58 bln
+11.48 bln
7.75%
jan 1, 2005
159.52 bln
-60.0 mln
-0.04%
jan 1, 2006
169.24 bln
+9.72 bln
6.09%
jan 1, 2007
188.51 bln
+19.27 bln
11.39%
jan 1, 2008
221.048 bln
+32.538 bln
17.26%
jan 1, 2009
244.104 bln
+23.056 bln
10.43%
jan 1, 2010
282.084 bln
+37.98 bln
15.56%
jan 1, 2011
300.557 bln
+18.473 bln
6.55%
jan 1, 2012
368.819 bln
+68.262 bln
22.71%
jan 1, 2013
340.959 bln
-27.86 bln
-7.55%
jan 1, 2014
383.584 bln
+42.625 bln
12.5%
jan 1, 2015
424.675 bln
+41.091 bln
10.71%
Ranking of countries by current statistics by years


Comments: