29
/
en
AIzaSyAYiBZKx7MnpbEhh9jyipgxe19OcubqV5w
April 1, 2024
199888
Mongolia
MNG
true
2
1
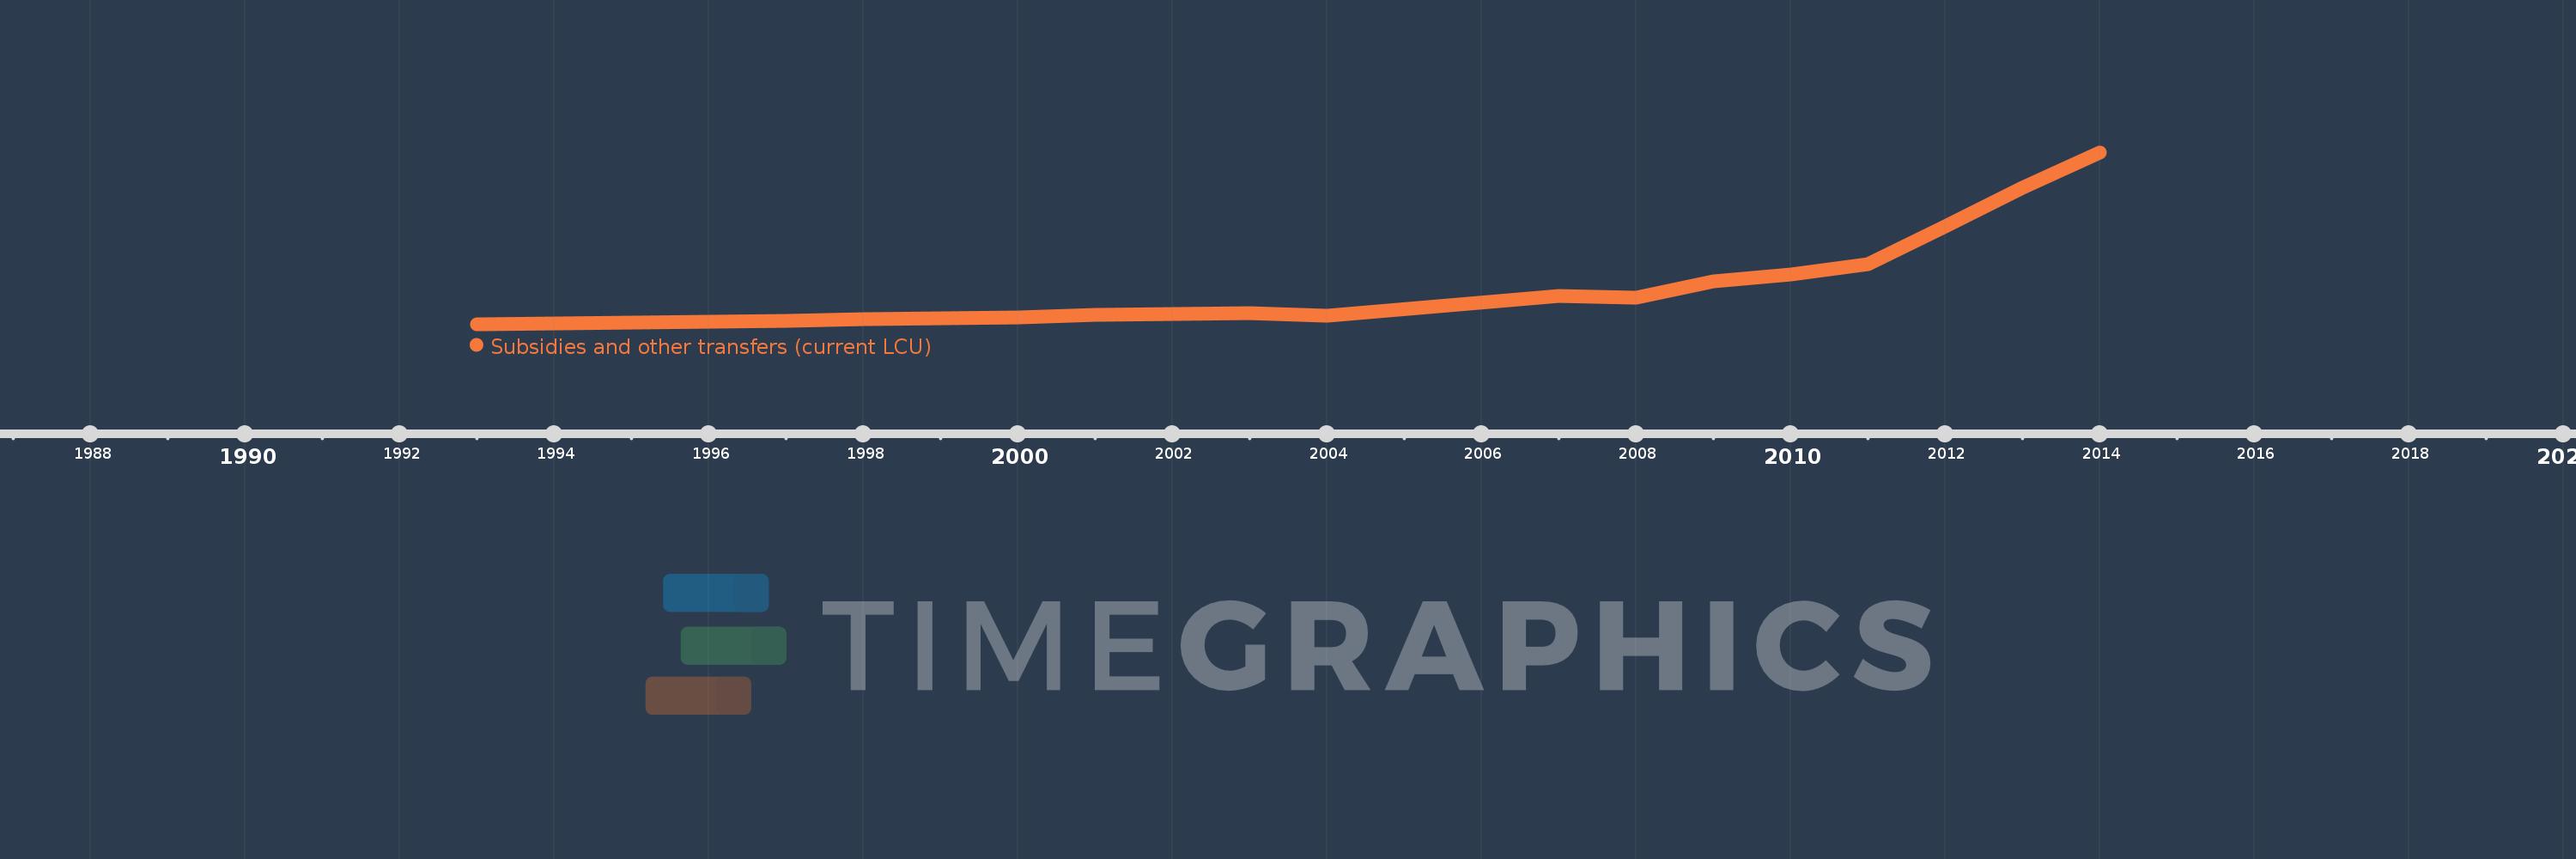
Subsidies and other transfers (current LCU)
2014,2013,2012,2011,2010,2009,2008,2007,2004,2003,2002,2001,2000,1999,1998,1997,1996,1995,1994,1993
This statistics in other country:
AfghanistanAlbaniaAlgeriaAngolaAntigua and BarbudaArmeniaAustraliaAustriaAzerbaijanBahamas, TheBahrainBangladeshBarbadosBelarusBelgiumBelizeBeninBhutanBoliviaBosnia and HerzegovinaBotswanaBrazilBulgariaBurkina FasoBurundiCabo VerdeCambodiaCanadaCentral African RepublicChileColombiaCongo, Dem. Rep.Congo, Rep.Costa RicaCote d'IvoireCroatiaCyprusCzech RepublicDenmarkDominicaDominican RepublicEgypt, Arab Rep.El SalvadorEquatorial GuineaEstoniaEthiopiaFijiFinlandFranceGambia, TheGeorgiaGermanyGhanaGreeceGrenadaGuatemalaHondurasHong Kong SAR, ChinaHungaryIcelandIndiaIndonesiaIran, Islamic Rep.IraqIrelandIsraelItalyJamaicaJapanJordanKazakhstanKenyaKiribatiKorea, Rep.KuwaitKyrgyz RepublicLao PDRLatviaLebanonLesothoLiberiaLithuaniaLuxembourgMacao SAR, ChinaMacedonia, FYRMadagascarMalawiMalaysiaMaldivesMaliMaltaMauritiusMicronesia, Fed. Sts.MoldovaMongoliaMoroccoMozambiqueNamibiaNepalNetherlandsNew ZealandNicaraguaNigeriaNorwayOmanPakistanPanamaPapua New GuineaParaguayPeruPhilippinesPolandPortugalQatarRomaniaRussian FederationRwandaSamoaSan MarinoSao Tome and PrincipeSenegalSerbiaSeychellesSierra LeoneSingaporeSlovak RepublicSloveniaSolomon IslandsSouth AfricaSpainSri LankaSt. Kitts and NevisSt. LuciaSurinameSwazilandSwedenSwitzerlandSyrian Arab RepublicTajikistanTanzaniaThailandTimor-LesteTogoTrinidad and TobagoTunisiaTurkeyUgandaUkraineUnited Arab EmiratesUnited KingdomUnited StatesUruguayVanuatuVenezuela, RBWest Bank and GazaYemen, Rep.ZambiaZimbabwe Timeline:
This timeline shows a graph from 1993 to 2014 of Mongolia. No data until 1992. Number of actual observations by date: 20.
Source name:
World Development Indicators
Source organization:
International Monetary Fund, Government Finance Statistics Yearbook and data files.
Categories, topics:
Public Sector
Last updated:
apr 23, 2017
Indicators value changes by year
Minimum:
5.692 bln
jan 1, 1993
Maximum:
2.675 trl
jan 1, 2014
At the date of observation
Value
Absolute change
Change from previous value
jan 1, 1993
5.692 bln
+5.692 bln
0.0%
jan 1, 1994
21.165 bln
+15.473 bln
271.84%
jan 1, 1995
30.252 bln
+9.087 bln
42.93%
jan 1, 1996
42.446 bln
+12.194 bln
40.31%
jan 1, 1997
55.479 bln
+13.033 bln
30.7%
jan 1, 1998
77.889 bln
+22.41 bln
40.39%
jan 1, 1999
94.671 bln
+16.782 bln
21.55%
jan 1, 2000
109.049 bln
+14.378 bln
15.19%
jan 1, 2001
153.09 bln
+44.041 bln
40.39%
jan 1, 2002
162.275 bln
+9.185 bln
6.0%
jan 1, 2003
174.745 bln
+12.47 bln
7.68%
jan 1, 2004
137.796 bln
-36.949 bln
-21.14%
jan 1, 2007
441.3 bln
+303.504 bln
220.26%
jan 1, 2008
418.91 bln
-22.39 bln
-5.07%
jan 1, 2009
666.875 bln
+247.965 bln
59.19%
jan 1, 2010
776.97 bln
+110.095 bln
16.51%
jan 1, 2011
938.228 bln
+161.258 bln
20.75%
jan 1, 2012
1.522 trl
+584.262 bln
62.27%
jan 1, 2013
2.123 trl
+600.245 bln
39.43%
jan 1, 2014
2.675 trl
+552.375 bln
26.02%
Ranking of countries by current statistics by years


Comments: