29
/
en
AIzaSyAYiBZKx7MnpbEhh9jyipgxe19OcubqV5w
April 1, 2024
178318
Lesotho
LSO
true
2
1
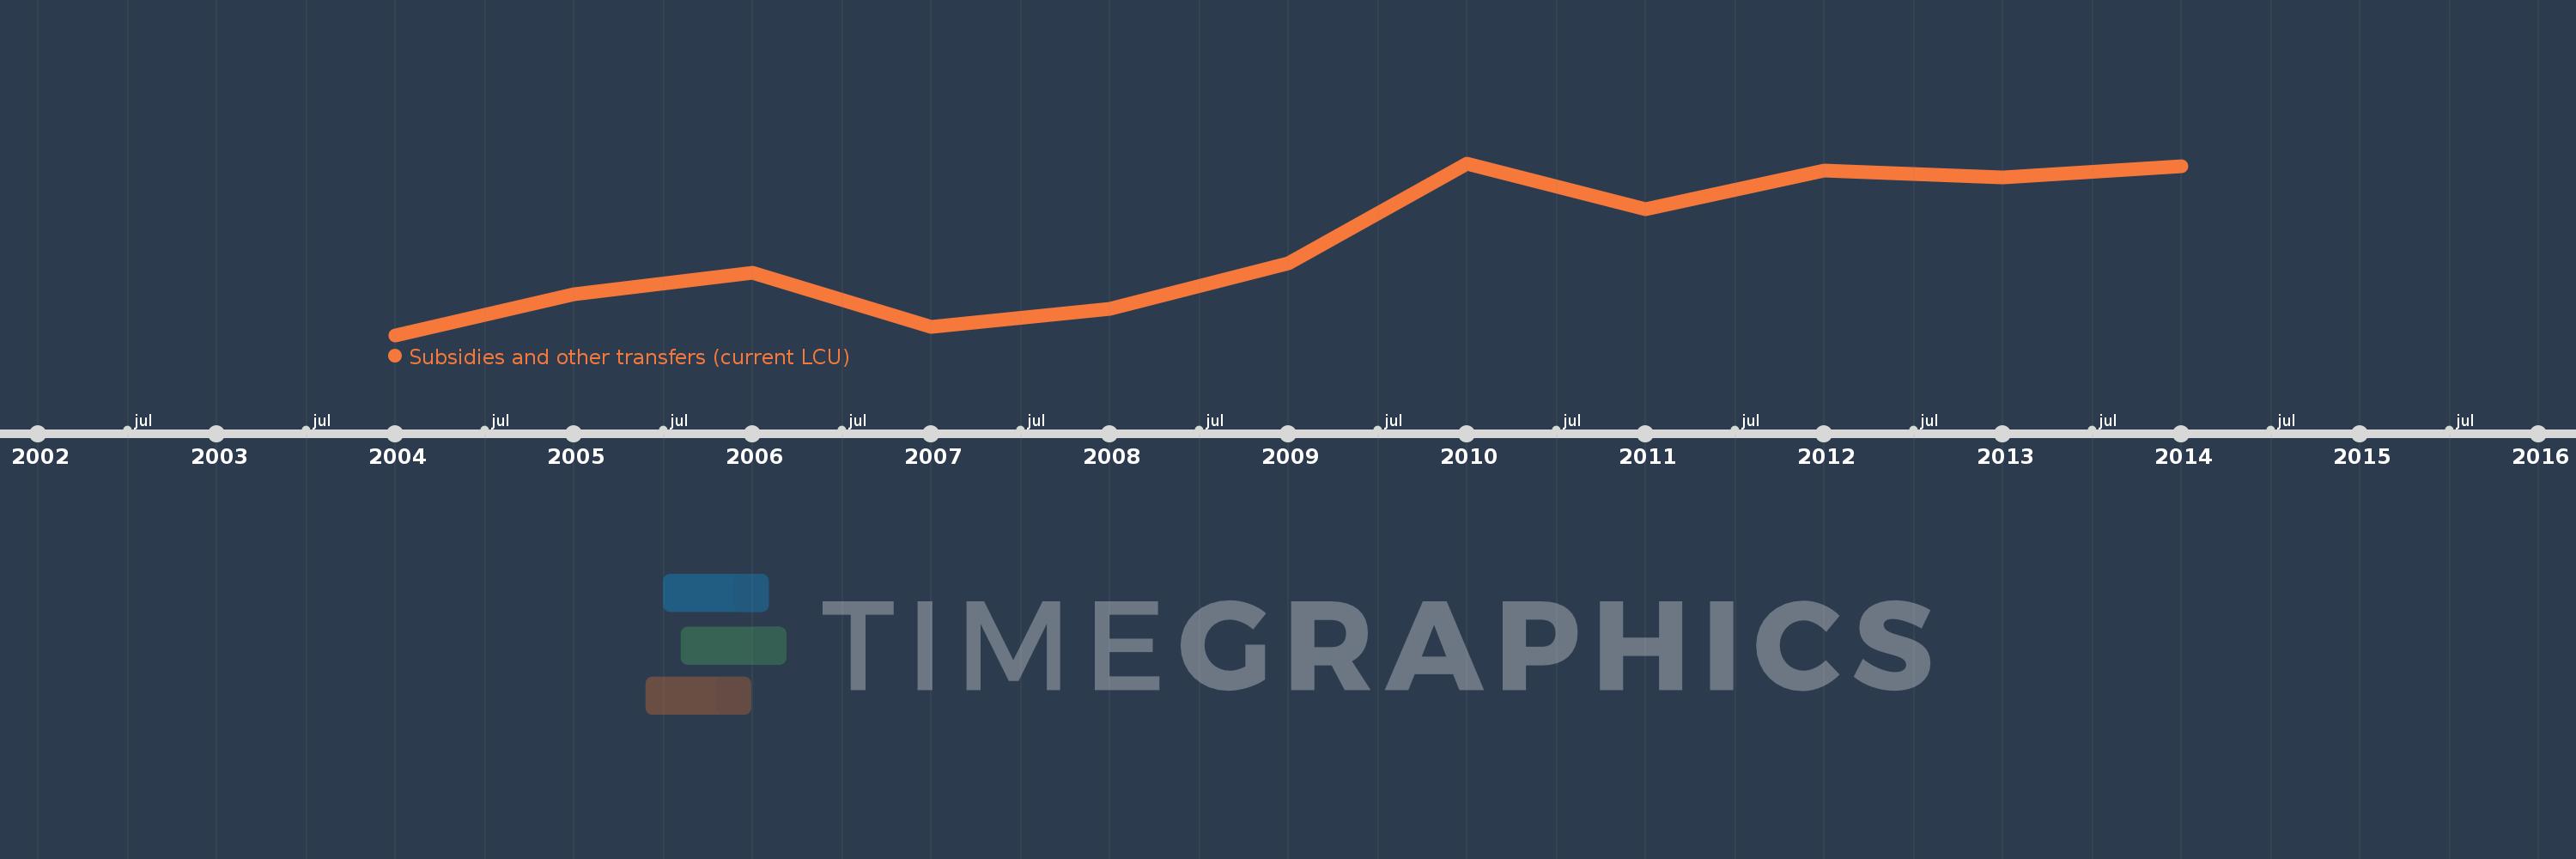
Subsidies and other transfers (current LCU)
2014,2013,2012,2011,2010,2009,2008,2007,2006,2005,2004
This statistics in other country:
AfghanistanAlbaniaAlgeriaAngolaAntigua and BarbudaArmeniaAustraliaAustriaAzerbaijanBahamas, TheBahrainBangladeshBarbadosBelarusBelgiumBelizeBeninBhutanBoliviaBosnia and HerzegovinaBotswanaBrazilBulgariaBurkina FasoBurundiCabo VerdeCambodiaCanadaCentral African RepublicChileColombiaCongo, Dem. Rep.Congo, Rep.Costa RicaCote d'IvoireCroatiaCyprusCzech RepublicDenmarkDominicaDominican RepublicEgypt, Arab Rep.El SalvadorEquatorial GuineaEstoniaEthiopiaFijiFinlandFranceGambia, TheGeorgiaGermanyGhanaGreeceGrenadaGuatemalaHondurasHong Kong SAR, ChinaHungaryIcelandIndiaIndonesiaIran, Islamic Rep.IraqIrelandIsraelItalyJamaicaJapanJordanKazakhstanKenyaKiribatiKorea, Rep.KuwaitKyrgyz RepublicLao PDRLatviaLebanonLesothoLiberiaLithuaniaLuxembourgMacao SAR, ChinaMacedonia, FYRMadagascarMalawiMalaysiaMaldivesMaliMaltaMauritiusMicronesia, Fed. Sts.MoldovaMongoliaMoroccoMozambiqueNamibiaNepalNetherlandsNew ZealandNicaraguaNigeriaNorwayOmanPakistanPanamaPapua New GuineaParaguayPeruPhilippinesPolandPortugalQatarRomaniaRussian FederationRwandaSamoaSan MarinoSao Tome and PrincipeSenegalSerbiaSeychellesSierra LeoneSingaporeSlovak RepublicSloveniaSolomon IslandsSouth AfricaSpainSri LankaSt. Kitts and NevisSt. LuciaSurinameSwazilandSwedenSwitzerlandSyrian Arab RepublicTajikistanTanzaniaThailandTimor-LesteTogoTrinidad and TobagoTunisiaTurkeyUgandaUkraineUnited Arab EmiratesUnited KingdomUnited StatesUruguayVanuatuVenezuela, RBWest Bank and GazaYemen, Rep.ZambiaZimbabwe Timeline:
This timeline shows a graph from 2004 to 2014 of Lesotho. No data until 2003. Number of actual observations by date: 11.
Source name:
World Development Indicators
Source organization:
International Monetary Fund, Government Finance Statistics Yearbook and data files.
Categories, topics:
Public Sector
Last updated:
apr 23, 2017
Indicators value changes by year
Minimum:
727.63 mln
jan 1, 2004
Maximum:
1.826 bln
jan 1, 2010
At the date of observation
Value
Absolute change
Change from previous value
jan 1, 2004
727.63 mln
+727.63 mln
0.0%
jan 1, 2005
989.009 mln
+261.379 mln
35.92%
jan 1, 2006
1.127 bln
+137.806 mln
13.93%
jan 1, 2007
777.143 mln
-349.672 mln
-31.03%
jan 1, 2008
892.82 mln
+115.677 mln
14.88%
jan 1, 2009
1.188 bln
+295.38 mln
33.08%
jan 1, 2010
1.826 bln
+638.213 mln
53.71%
jan 1, 2011
1.533 bln
-293.801 mln
-16.09%
jan 1, 2012
1.782 bln
+249.451 mln
16.28%
jan 1, 2013
1.734 bln
-48.551 mln
-2.72%
jan 1, 2014
1.805 bln
+71.795 mln
4.14%
Ranking of countries by current statistics by years


Comments: