29
/
en
AIzaSyAYiBZKx7MnpbEhh9jyipgxe19OcubqV5w
April 1, 2024
105486
Chile
CHL
true
2
1
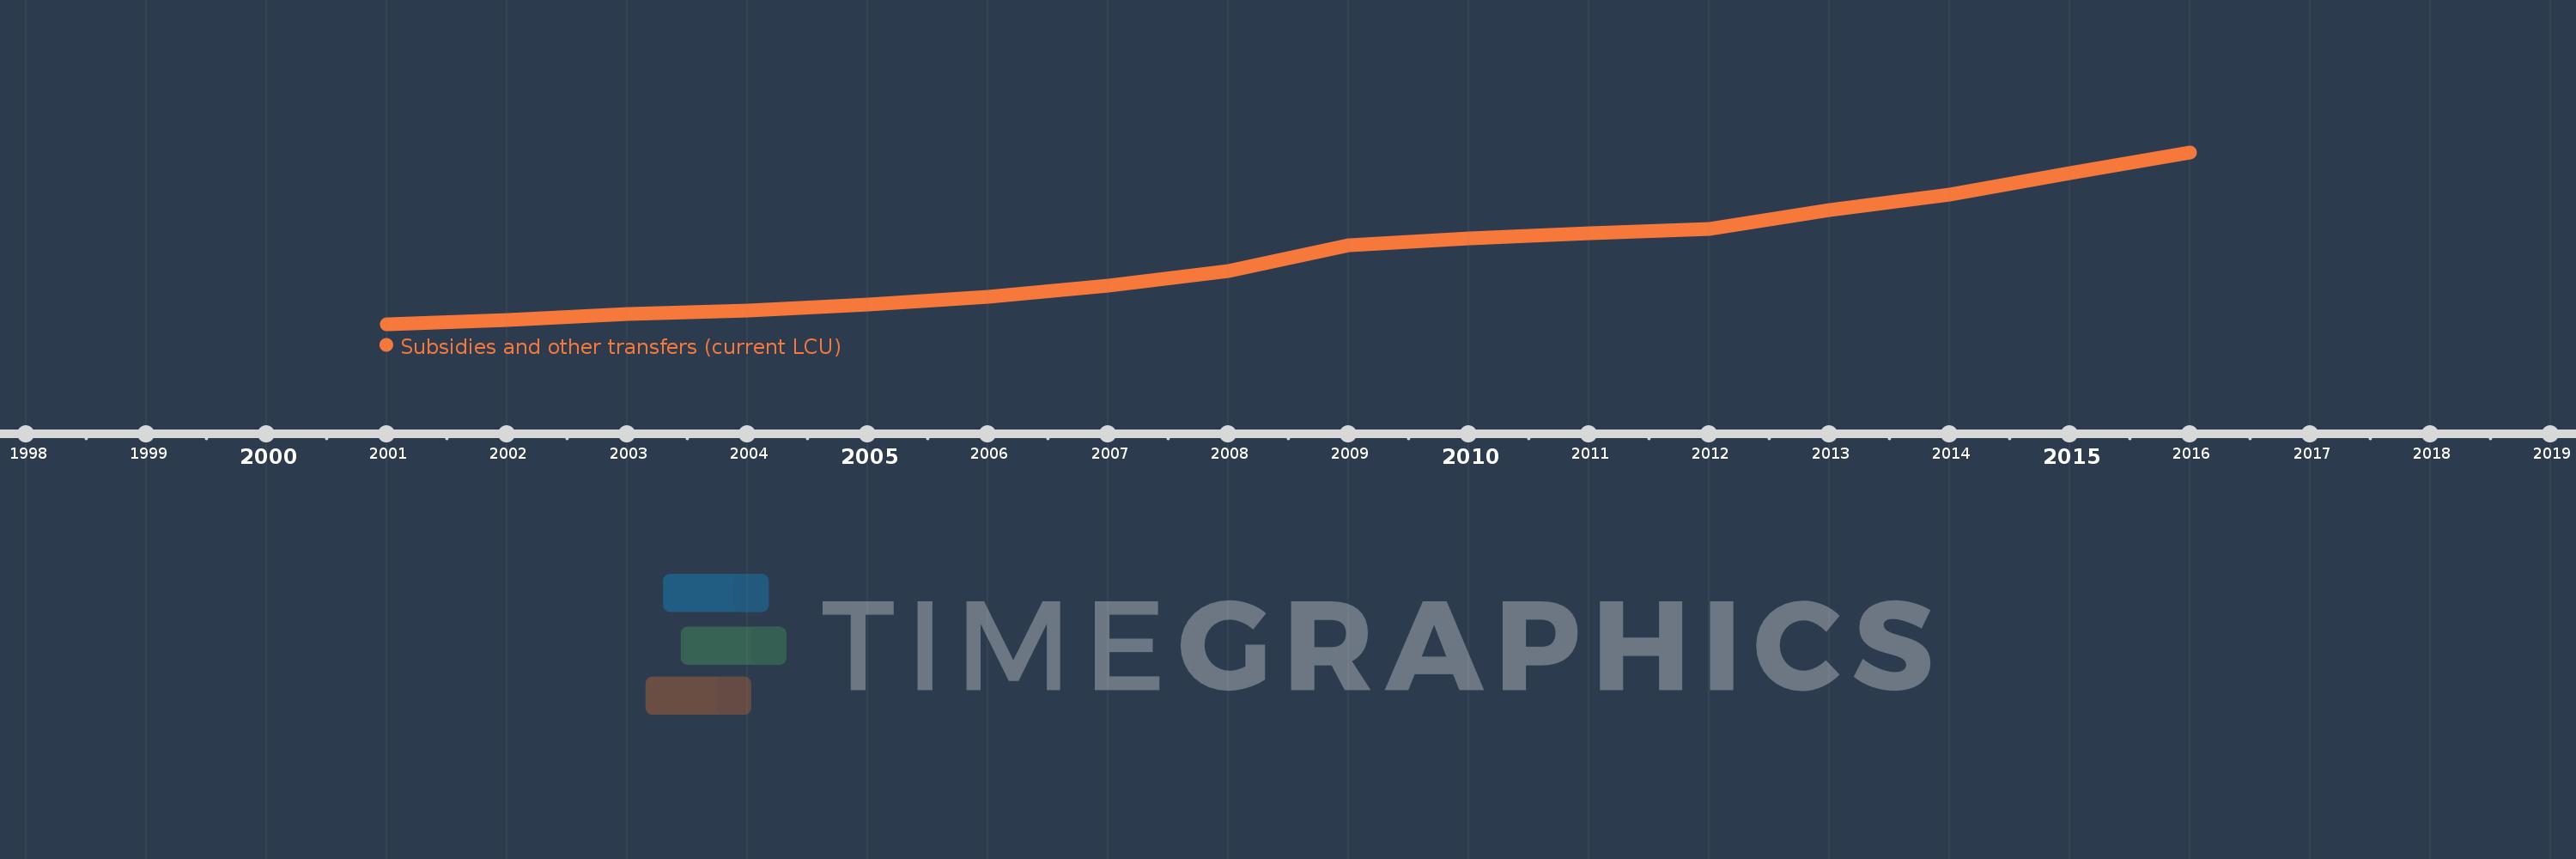
Subsidies and other transfers (current LCU)
2016,2015,2014,2013,2012,2011,2010,2009,2008,2007,2006,2005,2004,2003,2002,2001
This statistics in other country:
AfghanistanAlbaniaAlgeriaAngolaAntigua and BarbudaArmeniaAustraliaAustriaAzerbaijanBahamas, TheBahrainBangladeshBarbadosBelarusBelgiumBelizeBeninBhutanBoliviaBosnia and HerzegovinaBotswanaBrazilBulgariaBurkina FasoBurundiCabo VerdeCambodiaCanadaCentral African RepublicChileColombiaCongo, Dem. Rep.Congo, Rep.Costa RicaCote d'IvoireCroatiaCyprusCzech RepublicDenmarkDominicaDominican RepublicEgypt, Arab Rep.El SalvadorEquatorial GuineaEstoniaEthiopiaFijiFinlandFranceGambia, TheGeorgiaGermanyGhanaGreeceGrenadaGuatemalaHondurasHong Kong SAR, ChinaHungaryIcelandIndiaIndonesiaIran, Islamic Rep.IraqIrelandIsraelItalyJamaicaJapanJordanKazakhstanKenyaKiribatiKorea, Rep.KuwaitKyrgyz RepublicLao PDRLatviaLebanonLesothoLiberiaLithuaniaLuxembourgMacao SAR, ChinaMacedonia, FYRMadagascarMalawiMalaysiaMaldivesMaliMaltaMauritiusMicronesia, Fed. Sts.MoldovaMongoliaMoroccoMozambiqueNamibiaNepalNetherlandsNew ZealandNicaraguaNigeriaNorwayOmanPakistanPanamaPapua New GuineaParaguayPeruPhilippinesPolandPortugalQatarRomaniaRussian FederationRwandaSamoaSan MarinoSao Tome and PrincipeSenegalSerbiaSeychellesSierra LeoneSingaporeSlovak RepublicSloveniaSolomon IslandsSouth AfricaSpainSri LankaSt. Kitts and NevisSt. LuciaSurinameSwazilandSwedenSwitzerlandSyrian Arab RepublicTajikistanTanzaniaThailandTimor-LesteTogoTrinidad and TobagoTunisiaTurkeyUgandaUkraineUnited Arab EmiratesUnited KingdomUnited StatesUruguayVanuatuVenezuela, RBWest Bank and GazaYemen, Rep.ZambiaZimbabwe Timeline:
This timeline shows a graph from 2001 to 2016 of Chile. No data until 2000. Number of actual observations by date: 16.
Source name:
World Development Indicators
Source organization:
International Monetary Fund, Government Finance Statistics Yearbook and data files.
Categories, topics:
Public Sector
Last updated:
apr 23, 2017
Indicators value changes by year
Minimum:
4.669 trl
jan 1, 2001
Maximum:
15.216 trl
jan 1, 2016
At the date of observation
Value
Absolute change
Change from previous value
jan 1, 2001
4.669 trl
+4.669 trl
0.0%
jan 1, 2002
4.935 trl
+266.11 bln
5.7%
jan 1, 2003
5.289 trl
+353.67 bln
7.17%
jan 1, 2004
5.529 trl
+240.2 bln
4.54%
jan 1, 2005
5.852 trl
+322.42 bln
5.83%
jan 1, 2006
6.375 trl
+523.22 bln
8.94%
jan 1, 2007
7.037 trl
+662.0 bln
10.38%
jan 1, 2008
7.911 trl
+873.539 bln
12.41%
jan 1, 2009
9.539 trl
+1.628 trl
20.58%
jan 1, 2010
9.928 trl
+389.212 bln
4.08%
jan 1, 2011
10.236 trl
+308.163 bln
3.1%
jan 1, 2012
10.533 trl
+296.515 bln
2.9%
jan 1, 2013
11.704 trl
+1.171 trl
11.12%
jan 1, 2014
12.617 trl
+913.15 bln
7.8%
jan 1, 2015
13.959 trl
+1.342 trl
10.64%
jan 1, 2016
15.216 trl
+1.257 trl
9.01%
Ranking of countries by current statistics by years


Comments: