29
/
en
AIzaSyAYiBZKx7MnpbEhh9jyipgxe19OcubqV5w
April 1, 2024
65211
Albania
ALB
true
2
1
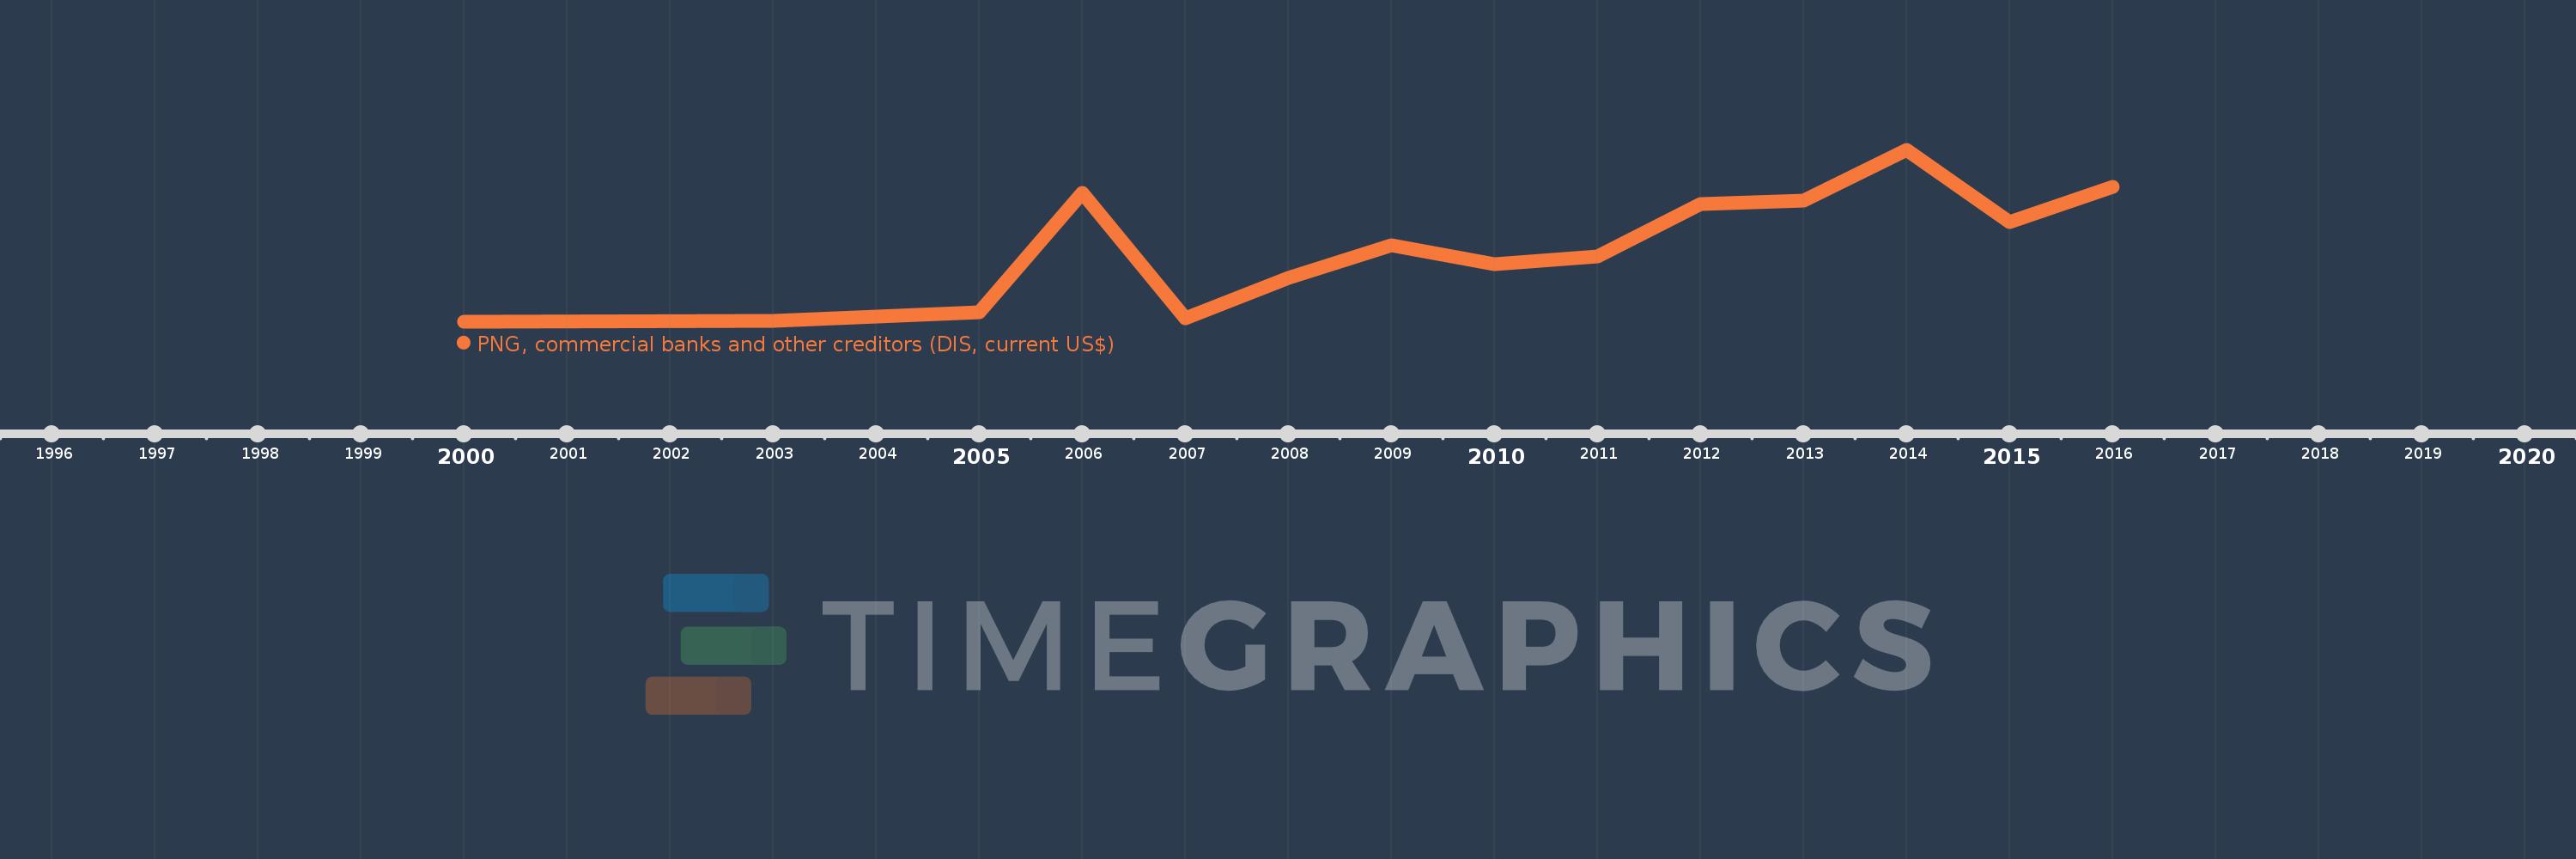
PNG, commercial banks and other creditors (DIS, current US$)
2016,2015,2014,2013,2012,2011,2010,2009,2008,2007,2006,2005,2003,2000
This statistics in other country:
Timeline:
This timeline shows a graph from 2000 to 2016 of Albania. No data until 1999. Number of actual observations by date: 14.
Source name:
World Development Indicators
Source organization:
World Bank, International Debt Statistics.
Categories, topics:
External Debt
Last updated:
apr 23, 2017
Indicators value changes by year
Minimum:
1000.0K
jan 1, 2000
Maximum:
490.829 mln
jan 1, 2014
At the date of observation
Value
Absolute change
Change from previous value
jan 1, 2000
1000.0K
+1000.0K
0.0%
jan 1, 2003
3.147 mln
+2.147 mln
214.7%
jan 1, 2005
29.263 mln
+26.116 mln
829.87%
jan 1, 2006
370.045 mln
+340.782 mln
1.16K%
jan 1, 2007
12.301 mln
-357.744 mln
-96.68%
jan 1, 2008
126.558 mln
+114.257 mln
928.84%
jan 1, 2009
220.315 mln
+93.757 mln
74.08%
jan 1, 2010
166.812 mln
-53.503 mln
-24.28%
jan 1, 2011
188.789 mln
+21.977 mln
13.17%
jan 1, 2012
336.336 mln
+147.547 mln
78.15%
jan 1, 2013
347.046 mln
+10.71 mln
3.18%
jan 1, 2014
490.829 mln
+143.783 mln
41.43%
jan 1, 2015
284.635 mln
-206.194 mln
-42.01%
jan 1, 2016
385.085 mln
+100.45 mln
35.29%
Ranking of countries by current statistics by years


Comments: