29
/
en
AIzaSyAYiBZKx7MnpbEhh9jyipgxe19OcubqV5w
April 1, 2024
106432
China
CHN
true
2
1
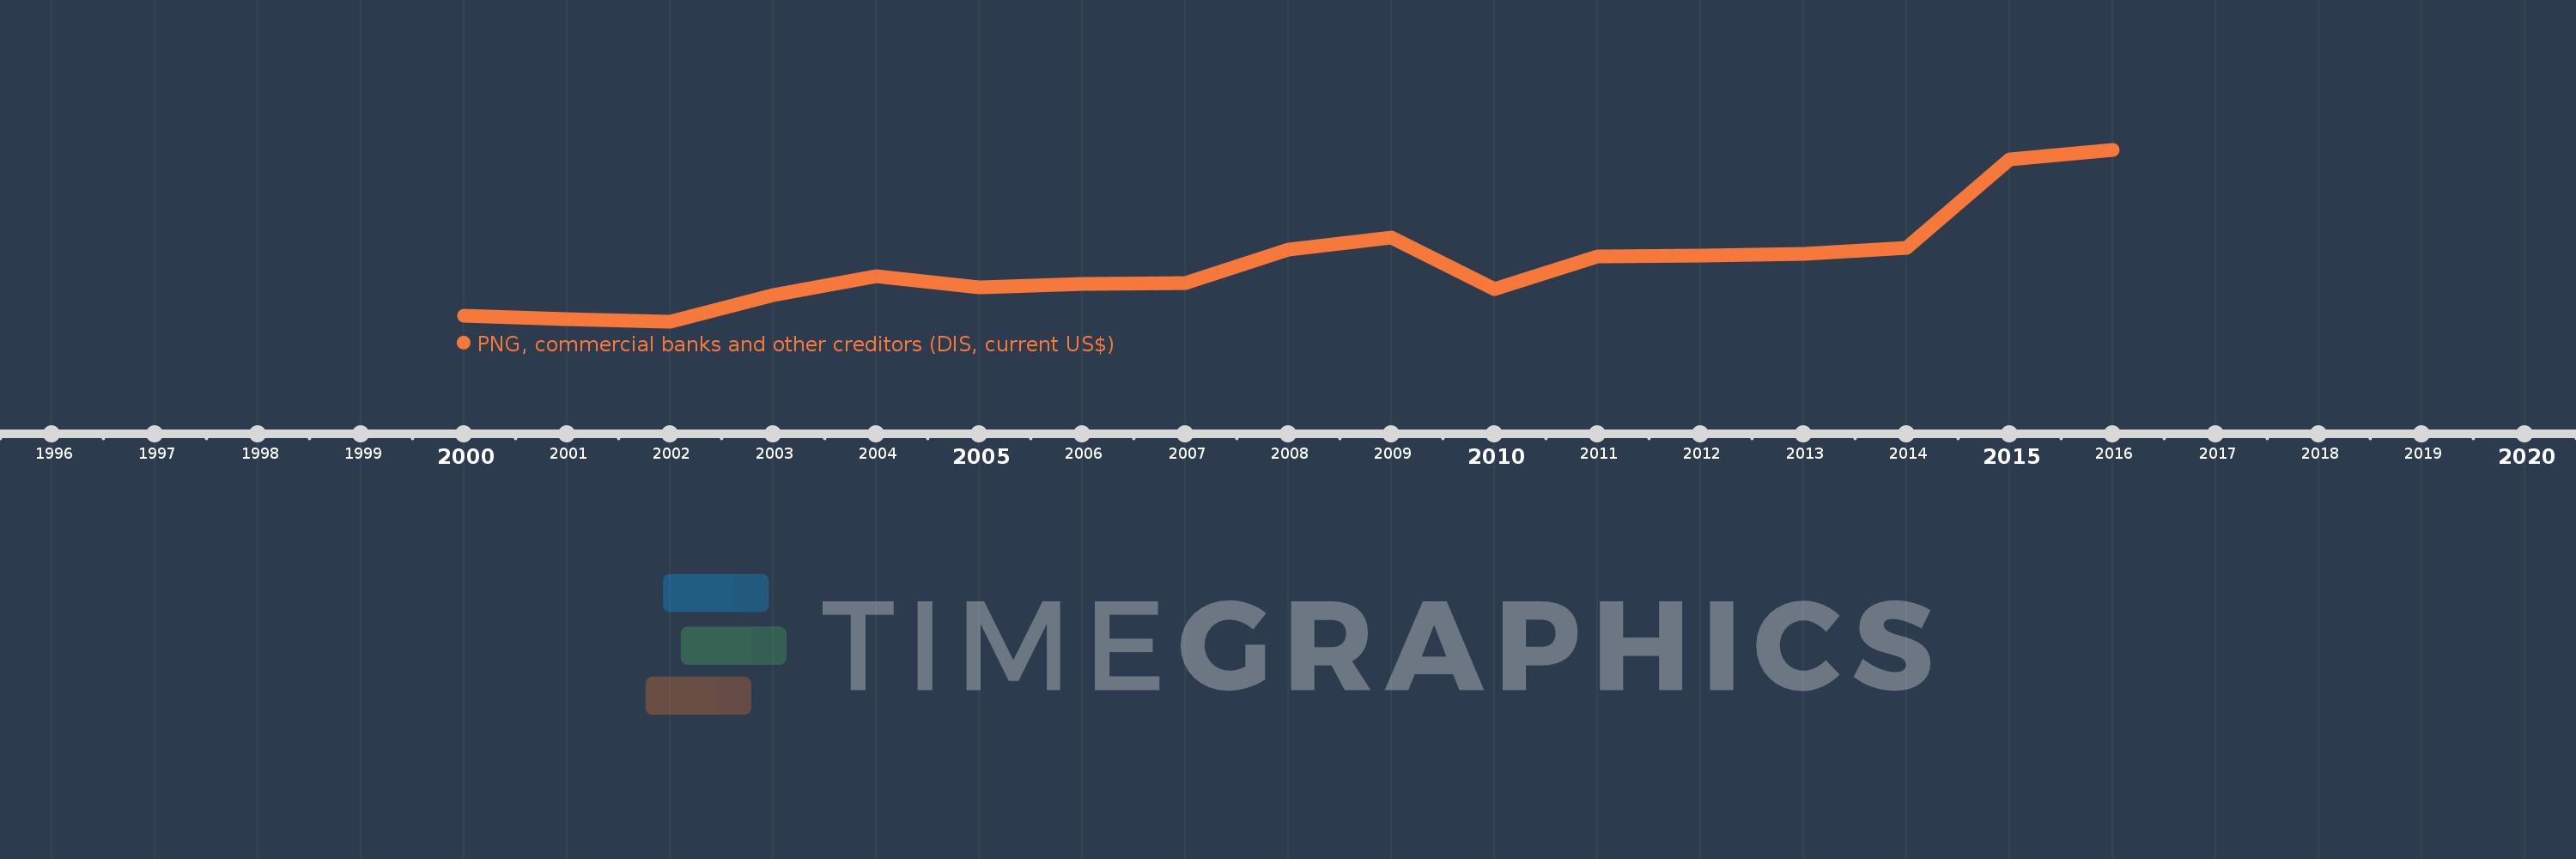
PNG, commercial banks and other creditors (DIS, current US$)
2016,2015,2014,2013,2012,2011,2010,2009,2008,2007,2006,2005,2004,2003,2002,2001,2000
This statistics in other country:
Timeline:
This timeline shows a graph from 2000 to 2016 of China. No data until 1999. Number of actual observations by date: 17.
Source name:
World Development Indicators
Source organization:
World Bank, International Debt Statistics.
Categories, topics:
External Debt
Last updated:
apr 23, 2017
Indicators value changes by year
Minimum:
5.694 bln
jan 1, 2002
Maximum:
60.973 bln
jan 1, 2016
At the date of observation
Value
Absolute change
Change from previous value
jan 1, 2000
7.665 bln
+7.665 bln
0.0%
jan 1, 2001
6.692 bln
-973.0 mln
-12.69%
jan 1, 2002
5.694 bln
-997.647 mln
-14.91%
jan 1, 2003
14.297 bln
+8.603 bln
151.07%
jan 1, 2004
20.441 bln
+6.144 bln
42.98%
jan 1, 2005
16.839 bln
-3.602 bln
-17.62%
jan 1, 2006
17.83 bln
+990.855 mln
5.88%
jan 1, 2007
18.301 bln
+471.145 mln
2.64%
jan 1, 2008
29.037 bln
+10.736 bln
58.66%
jan 1, 2009
32.739 bln
+3.702 bln
12.75%
jan 1, 2010
16.242 bln
-16.497 bln
-50.39%
jan 1, 2011
26.746 bln
+10.504 bln
64.67%
jan 1, 2012
27.032 bln
+285.806 mln
1.07%
jan 1, 2013
27.748 bln
+716.086 mln
2.65%
jan 1, 2014
29.519 bln
+1.771 bln
6.38%
jan 1, 2015
57.937 bln
+28.418 bln
96.27%
jan 1, 2016
60.973 bln
+3.035 bln
5.24%
Ranking of countries by current statistics by years


Comments: