29
/
en
AIzaSyAYiBZKx7MnpbEhh9jyipgxe19OcubqV5w
April 1, 2024
126689
El Salvador
SLV
true
2
1
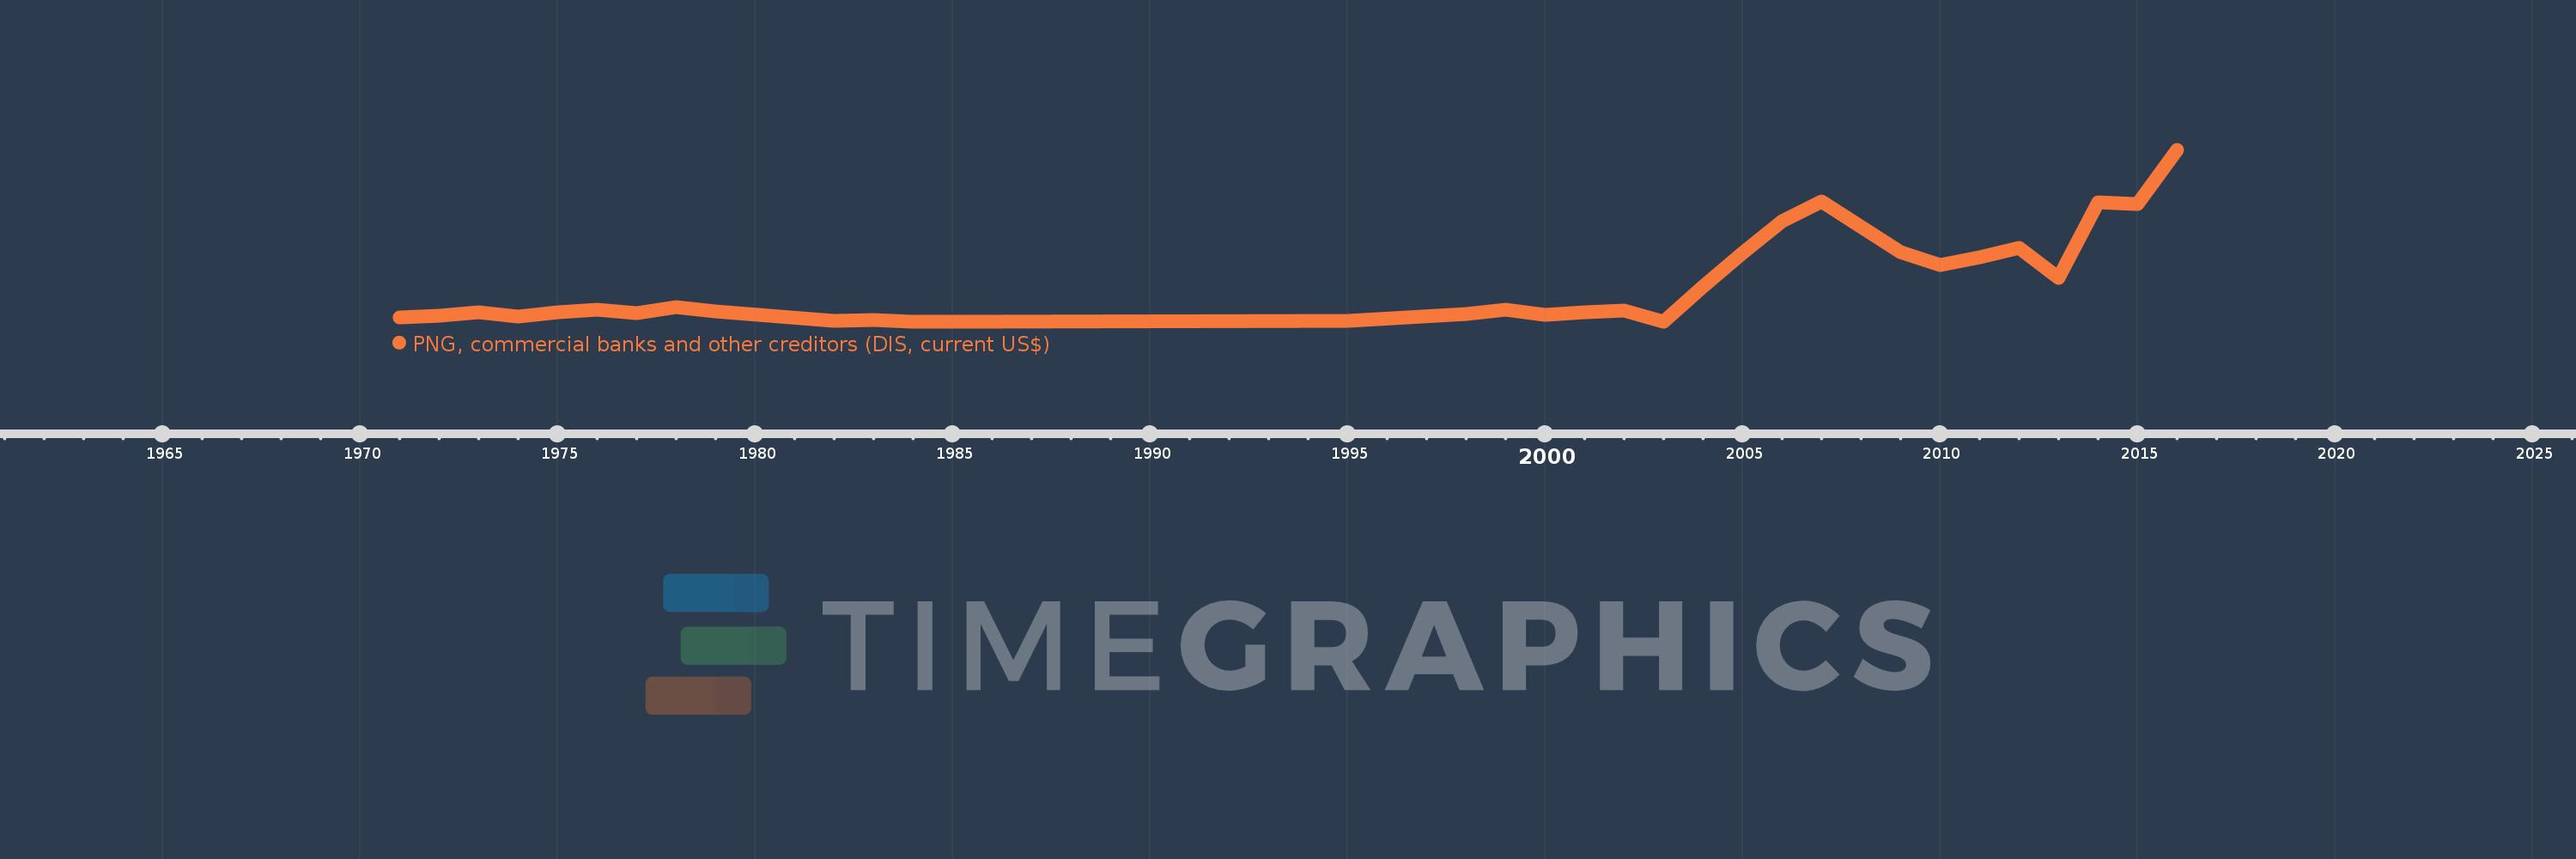
PNG, commercial banks and other creditors (DIS, current US$)
2016,2015,2014,2013,2012,2011,2010,2009,2007,2006,2005,2004,2003,2002,2001,2000,1999,1998,1995,1985,1984,1983,1982,1979,1978,1977,1976,1975,1974,1973,1972,1971
This statistics in other country:
Timeline:
This timeline shows a graph from 1971 to 2016 of El Salvador. No data until 1970. Number of actual observations by date: 32.
Source name:
World Development Indicators
Source organization:
World Bank, International Debt Statistics.
Categories, topics:
External Debt
Last updated:
apr 23, 2017
Indicators value changes by year
Minimum:
100.0K
jan 1, 1985
Maximum:
922.836 mln
jan 1, 2016
At the date of observation
Value
Absolute change
Change from previous value
jan 1, 1971
23.7 mln
+23.7 mln
0.0%
jan 1, 1972
31.8 mln
+8.1 mln
34.18%
jan 1, 1973
51.5 mln
+19.7 mln
61.95%
jan 1, 1974
30.9 mln
-20.6 mln
-40.0%
jan 1, 1975
52.6 mln
+21.7 mln
70.23%
jan 1, 1976
65.3 mln
+12.7 mln
24.14%
jan 1, 1977
46.5 mln
-18.8 mln
-28.79%
jan 1, 1978
79.0 mln
+32.5 mln
69.89%
jan 1, 1979
57.8 mln
-21.2 mln
-26.84%
jan 1, 1982
6.9 mln
-50.9 mln
-88.06%
jan 1, 1983
8.7 mln
+1.8 mln
26.09%
jan 1, 1984
2.2 mln
-6.5 mln
-74.71%
jan 1, 1985
100.0K
-2.1 mln
-95.45%
jan 1, 1995
4.0 mln
+3.9 mln
3.9K%
jan 1, 1998
44.0 mln
+40.0 mln
1000.0%
jan 1, 1999
65.0 mln
+21.0 mln
47.73%
jan 1, 2000
40.0 mln
-25.0 mln
-38.46%
jan 1, 2001
50.7 mln
+10.7 mln
26.75%
jan 1, 2002
60.0 mln
+9.3 mln
18.34%
jan 1, 2003
1.134 mln
-58.866 mln
-98.11%
jan 1, 2004
190.0 mln
+188.866 mln
16.65K%
jan 1, 2005
372.6 mln
+182.6 mln
96.11%
jan 1, 2006
540.0 mln
+167.4 mln
44.93%
jan 1, 2007
645.232 mln
+105.232 mln
19.49%
jan 1, 2009
375.783 mln
-269.449 mln
-41.76%
jan 1, 2010
305.782 mln
-70.001 mln
-18.63%
jan 1, 2011
347.539 mln
+41.757 mln
13.66%
jan 1, 2012
398.329 mln
+50.79 mln
14.61%
jan 1, 2013
236.488 mln
-161.841 mln
-40.63%
jan 1, 2014
642.383 mln
+405.895 mln
171.63%
jan 1, 2015
633.08 mln
-9.303 mln
-1.45%
jan 1, 2016
922.836 mln
+289.756 mln
45.77%
Ranking of countries by current statistics by years


Comments: