29
/
en
AIzaSyAYiBZKx7MnpbEhh9jyipgxe19OcubqV5w
April 1, 2024
246099
South Africa
ZAF
true
2
1
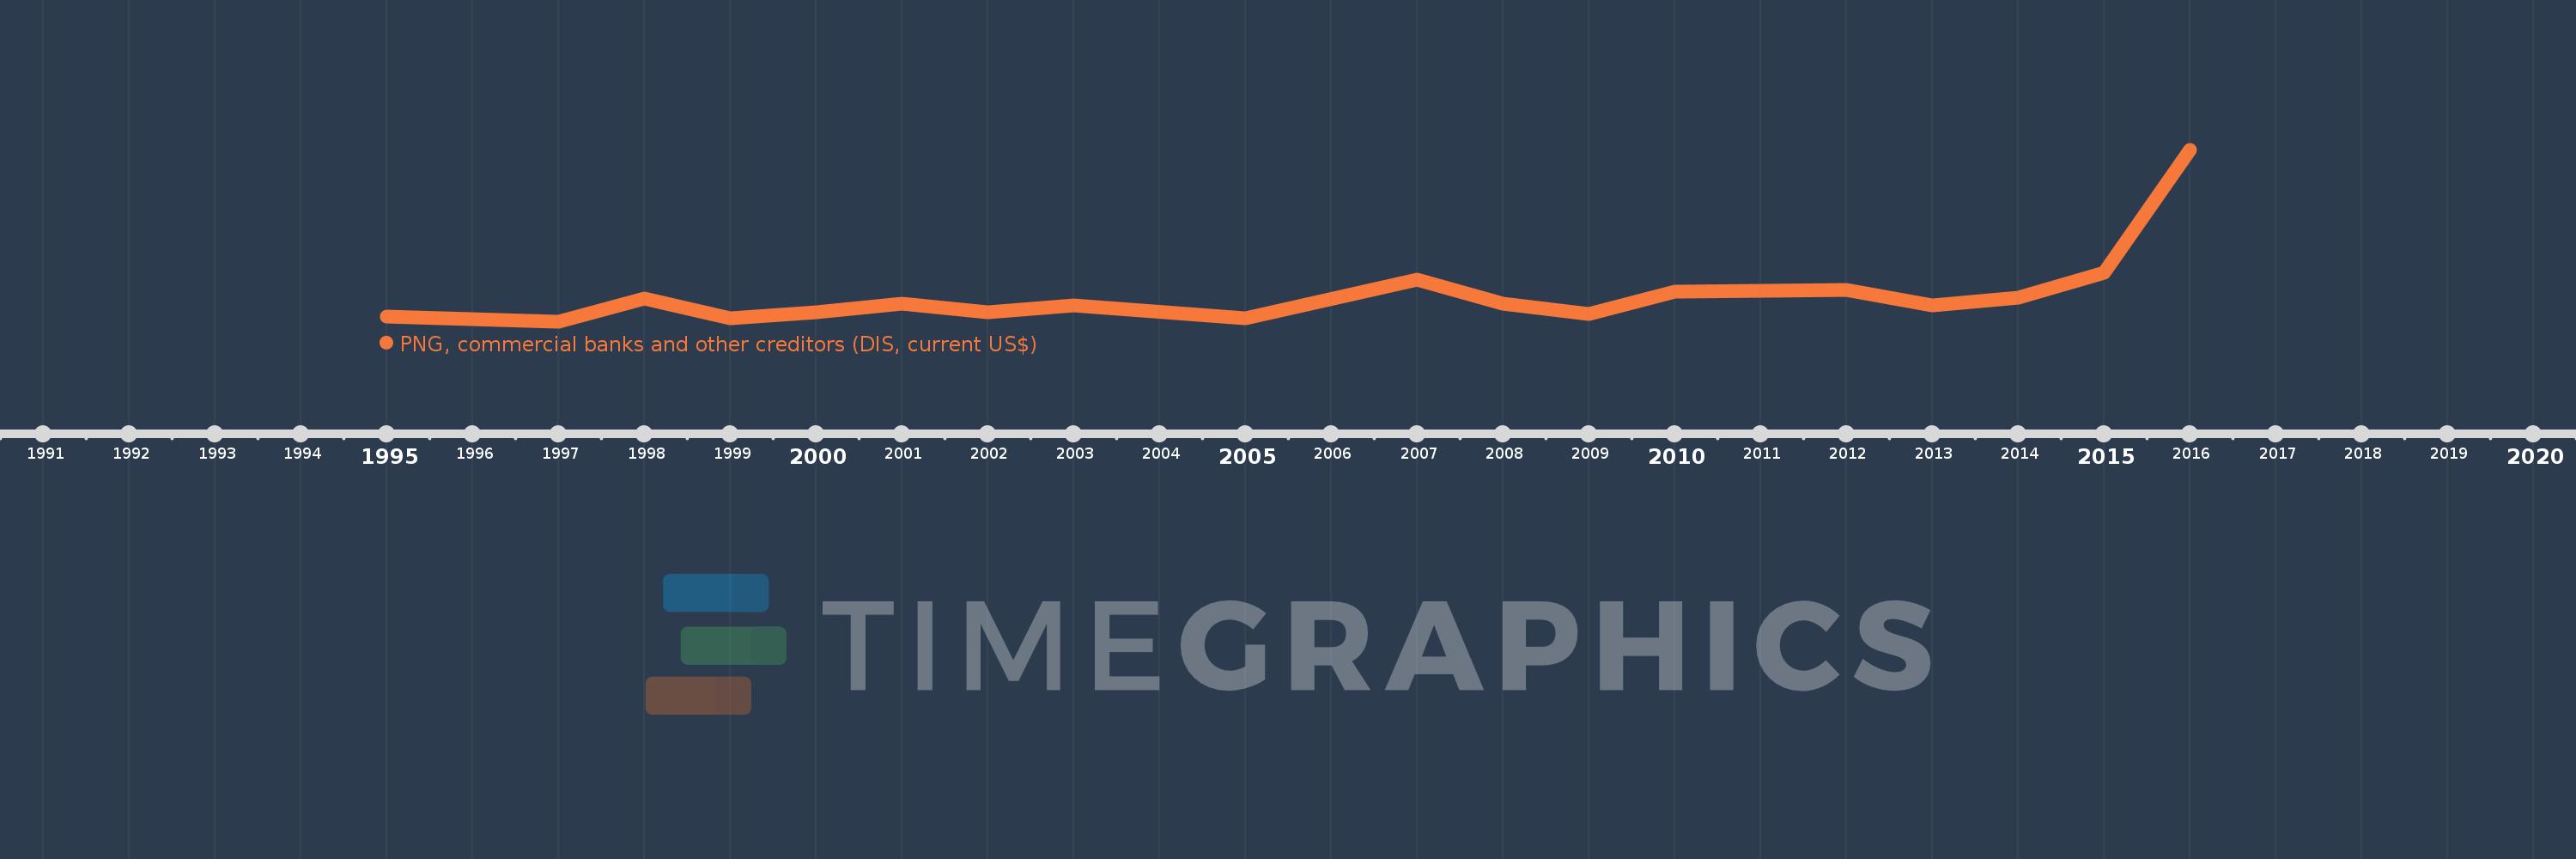
PNG, commercial banks and other creditors (DIS, current US$)
2016,2015,2014,2013,2012,2011,2010,2009,2008,2007,2005,2003,2002,2001,2000,1999,1998,1997,1995
This statistics in other country:
Timeline:
This timeline shows a graph from 1995 to 2016 of South Africa. No data until 1994. Number of actual observations by date: 19.
Source name:
World Development Indicators
Source organization:
World Bank, International Debt Statistics.
Categories, topics:
External Debt
Last updated:
apr 23, 2017
Indicators value changes by year
Minimum:
139.0 mln
jan 1, 1997
Maximum:
10.855 bln
jan 1, 2016
At the date of observation
Value
Absolute change
Change from previous value
jan 1, 1995
450.0 mln
+450.0 mln
0.0%
jan 1, 1997
139.0 mln
-311.0 mln
-69.11%
jan 1, 1998
1.581 bln
+1.442 bln
1.04K%
jan 1, 1999
382.662 mln
-1.198 bln
-75.8%
jan 1, 2000
728.0 mln
+345.338 mln
90.25%
jan 1, 2001
1.302 bln
+574.0 mln
78.85%
jan 1, 2002
750.0 mln
-552.0 mln
-42.4%
jan 1, 2003
1.172 bln
+422.0 mln
56.27%
jan 1, 2005
375.0 mln
-797.0 mln
-68.0%
jan 1, 2007
2.802 bln
+2.427 bln
647.2%
jan 1, 2008
1.27 bln
-1.532 bln
-54.68%
jan 1, 2009
652.0 mln
-618.0 mln
-48.66%
jan 1, 2010
2.007 bln
+1.355 bln
207.82%
jan 1, 2011
2.089 bln
+82.0 mln
4.09%
jan 1, 2012
2.153 bln
+64.169 mln
3.07%
jan 1, 2013
1.19 bln
-963.207 mln
-44.73%
jan 1, 2014
1.66 bln
+469.599 mln
39.46%
jan 1, 2015
3.225 bln
+1.566 bln
94.36%
jan 1, 2016
10.855 bln
+7.63 bln
236.55%
Ranking of countries by current statistics by years


Comments: