29
/
en
AIzaSyAYiBZKx7MnpbEhh9jyipgxe19OcubqV5w
April 1, 2024
199640
Mongolia
MNG
true
2
1
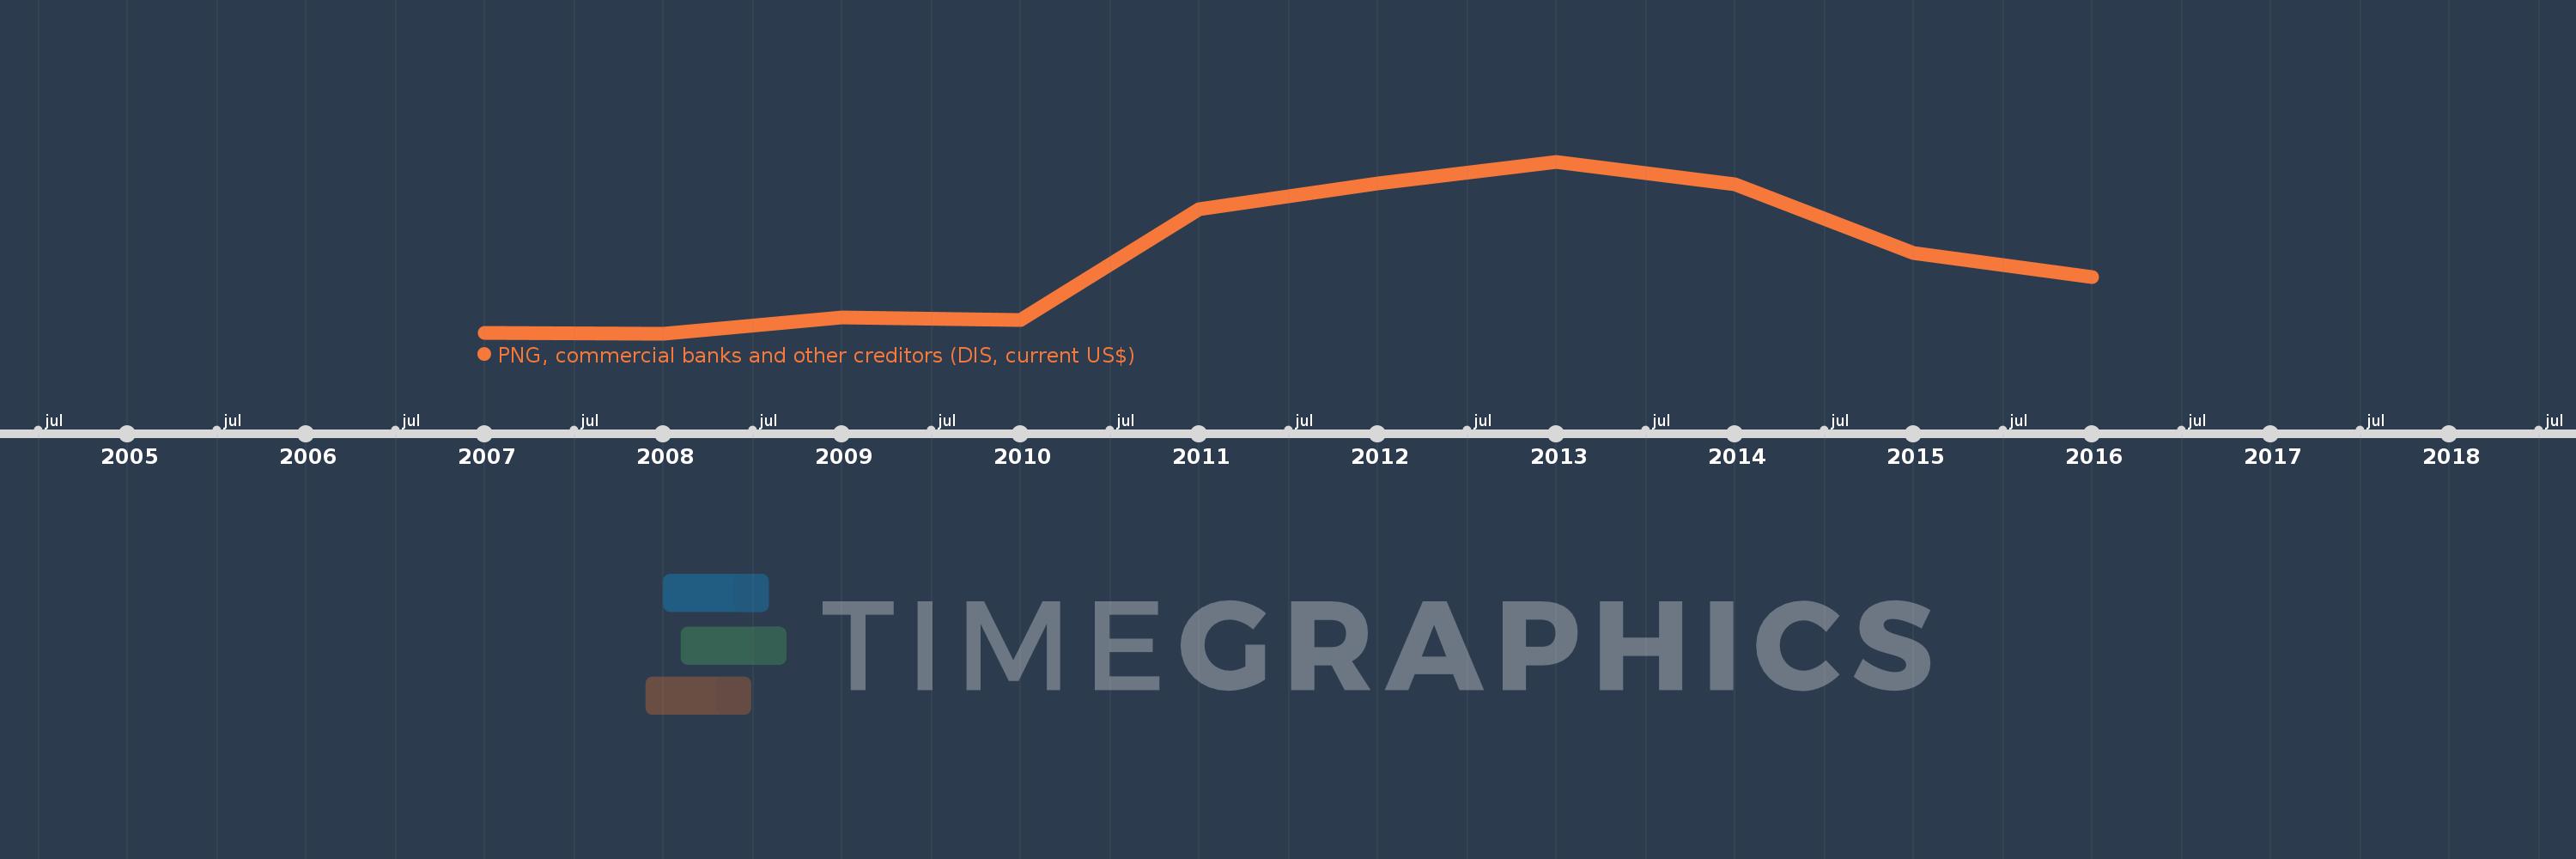
PNG, commercial banks and other creditors (DIS, current US$)
2016,2015,2014,2013,2012,2011,2010,2009,2008,2007
This statistics in other country:
Timeline:
This timeline shows a graph from 2007 to 2016 of Mongolia. No data until 2006. Number of actual observations by date: 10.
Source name:
World Development Indicators
Source organization:
World Bank, International Debt Statistics.
Categories, topics:
External Debt
Last updated:
apr 23, 2017
Indicators value changes by year
Minimum:
2.329 mln
jan 1, 2008
Maximum:
3.964 bln
jan 1, 2013
At the date of observation
Value
Absolute change
Change from previous value
jan 1, 2007
2.384 mln
+2.384 mln
0.0%
jan 1, 2008
2.329 mln
-55.0K
-2.31%
jan 1, 2009
360.265 mln
+357.936 mln
15.37K%
jan 1, 2010
307.555 mln
-52.71 mln
-14.63%
jan 1, 2011
2.863 bln
+2.555 bln
830.77%
jan 1, 2012
3.466 bln
+603.522 mln
21.08%
jan 1, 2013
3.964 bln
+498.314 mln
14.38%
jan 1, 2014
3.442 bln
-522.421 mln
-13.18%
jan 1, 2015
1.858 bln
-1.584 bln
-46.01%
jan 1, 2016
1.308 bln
-550.594 mln
-29.63%
Ranking of countries by current statistics by years


Comments: