29
/
en
AIzaSyAYiBZKx7MnpbEhh9jyipgxe19OcubqV5w
April 1, 2024
244021
Solomon Islands
SLB
true
2
1
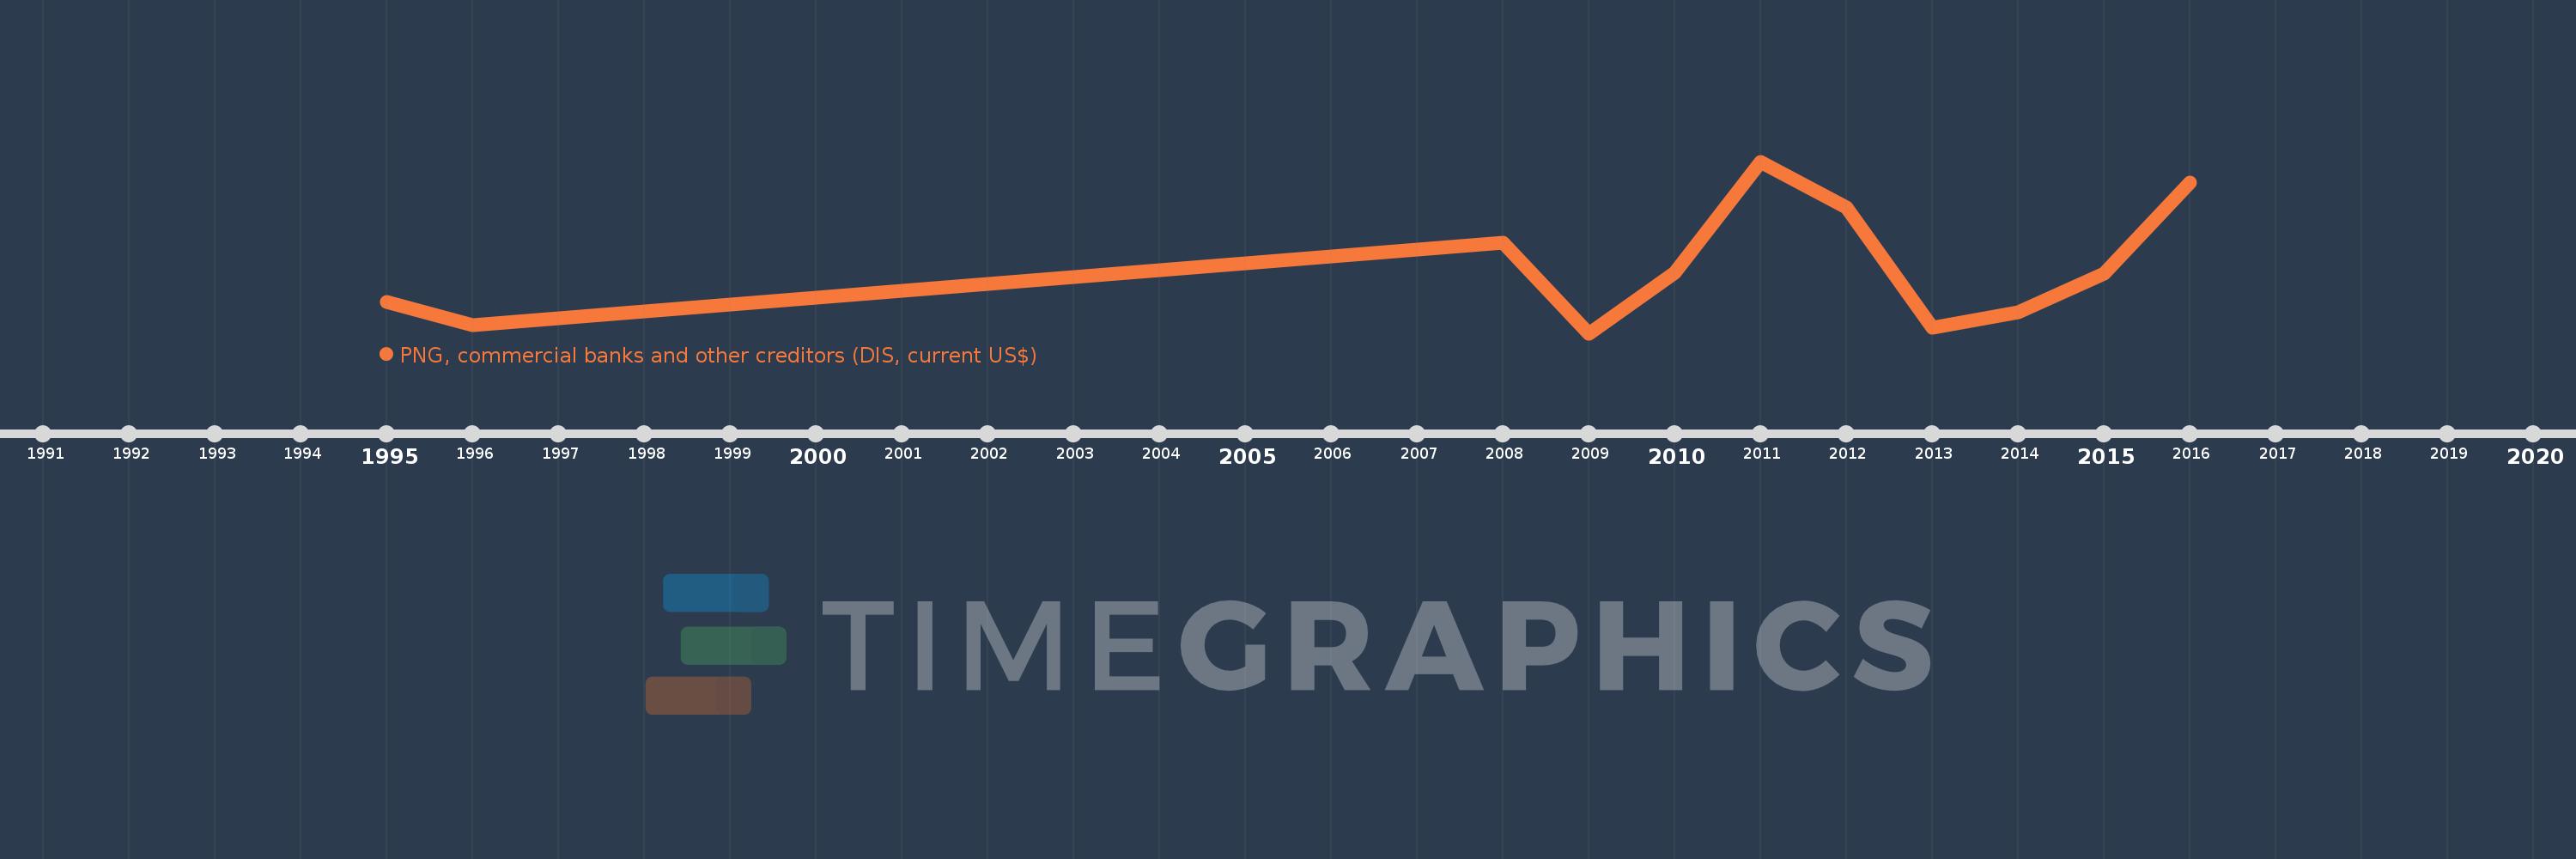
PNG, commercial banks and other creditors (DIS, current US$)
2016,2015,2014,2013,2012,2011,2010,2009,2008,1996,1995
This statistics in other country:
Timeline:
This timeline shows a graph from 1995 to 2016 of Solomon Islands. No data until 1994. Number of actual observations by date: 11.
Source name:
World Development Indicators
Source organization:
World Bank, International Debt Statistics.
Categories, topics:
External Debt
Last updated:
apr 23, 2017
Indicators value changes by year
Minimum:
1.027 mln
jan 1, 2009
Maximum:
36.849 mln
jan 1, 2011
At the date of observation
Value
Absolute change
Change from previous value
jan 1, 1995
7.552 mln
+7.552 mln
0.0%
jan 1, 1996
2.777 mln
-4.775 mln
-63.23%
jan 1, 2008
20.0 mln
+17.223 mln
620.2%
jan 1, 2009
1.027 mln
-18.973 mln
-94.86%
jan 1, 2010
13.691 mln
+12.664 mln
1.23K%
jan 1, 2011
36.849 mln
+23.158 mln
169.15%
jan 1, 2012
27.29 mln
-9.559 mln
-25.94%
jan 1, 2013
2.193 mln
-25.097 mln
-91.96%
jan 1, 2014
5.489 mln
+3.296 mln
150.3%
jan 1, 2015
13.402 mln
+7.913 mln
144.16%
jan 1, 2016
32.533 mln
+19.131 mln
142.75%
Ranking of countries by current statistics by years


Comments: