29
/
en
AIzaSyAYiBZKx7MnpbEhh9jyipgxe19OcubqV5w
April 1, 2024
62615
World
WLD
false
2
1
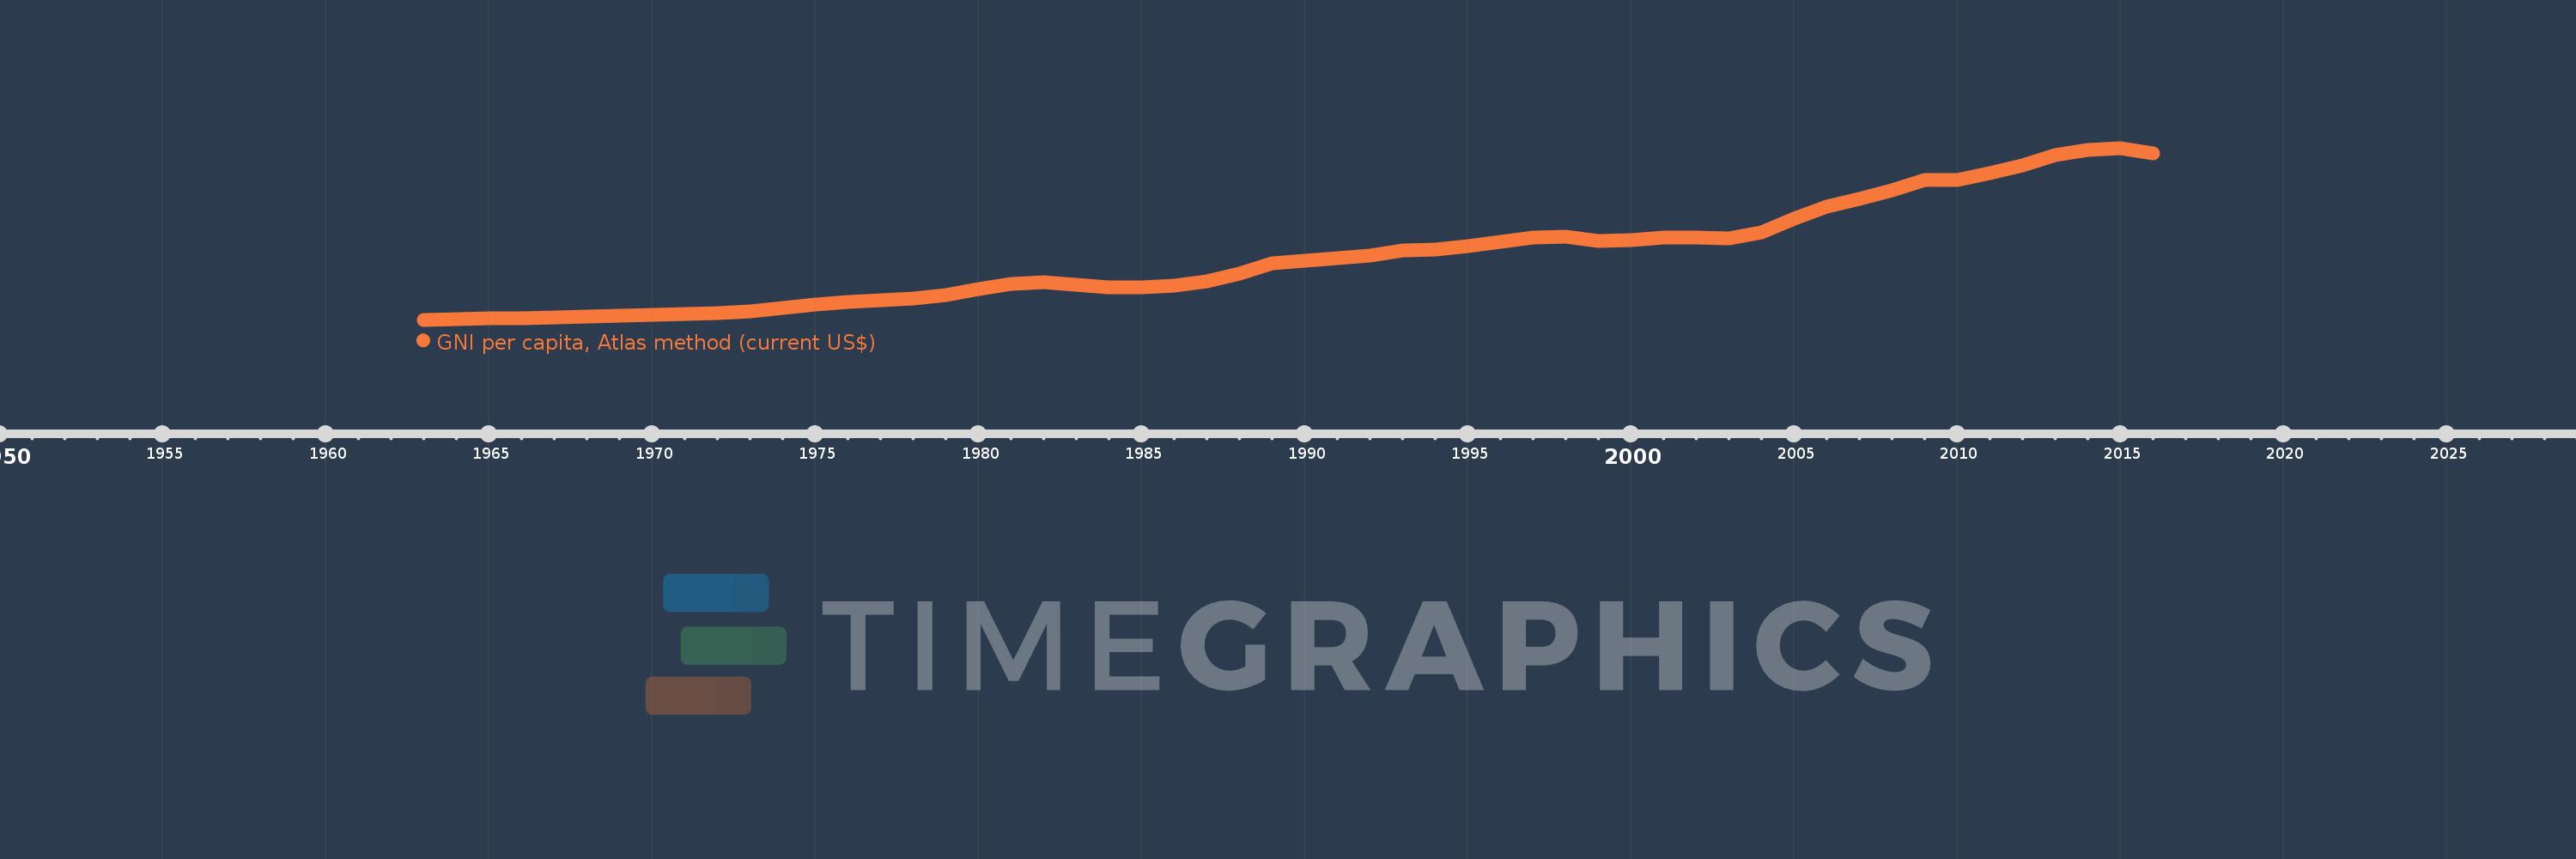
GNI per capita, Atlas method (current US$)
2016,2015,2014,2013,2012,2011,2010,2009,2008,2007,2006,2005,2004,2003,2002,2001,2000,1999,1998,1997,1996,1995,1994,1993,1992,1991,1990,1989,1988,1987,1986,1985,1984,1983,1982,1981,1980,1979,1978,1977,1976,1975,1974,1973,1972,1971,1970,1969,1968,1967,1966,1965,1964,1963
This statistics in other country:
AfghanistanAlbaniaAlgeriaAndorraAngolaAntigua and BarbudaArab WorldArgentinaArmeniaAustraliaAustriaAzerbaijanBahamas, TheBahrainBangladeshBarbadosBelarusBelgiumBelizeBeninBermudaBhutanBoliviaBosnia and HerzegovinaBotswanaBrazilBrunei DarussalamBulgariaBurkina FasoBurundiCabo VerdeCambodiaCameroonCanadaCaribbean small statesCentral African RepublicCentral Europe and the BalticsChadChannel IslandsChileChinaColombiaComorosCongo, Dem. Rep.Congo, Rep.Costa RicaCote d'IvoireCroatiaCubaCyprusCzech RepublicDenmarkDjiboutiDominicaDominican RepublicEarly-demographic dividendEast Asia & PacificEast Asia & Pacific (excluding high income)East Asia & Pacific (IDA & IBRD countries)EcuadorEgypt, Arab Rep.El SalvadorEquatorial GuineaEritreaEstoniaEthiopiaEuro areaEurope & Central AsiaEurope & Central Asia (excluding high income)Europe & Central Asia (IDA & IBRD countries)European UnionFijiFinlandFragile and conflict affected situationsFranceFrench PolynesiaGabonGambia, TheGeorgiaGermanyGhanaGreeceGreenlandGrenadaGuatemalaGuineaGuinea-BissauGuyanaHaitiHeavily indebted poor countries (HIPC)High incomeHondurasHong Kong SAR, ChinaHungaryIBRD onlyIcelandIDA & IBRD totalIDA blendIDA onlyIDA totalIndiaIndonesiaIran, Islamic Rep.IraqIrelandIsle of ManIsraelItalyJamaicaJapanJordanKazakhstanKenyaKiribatiKorea, Rep.KosovoKuwaitKyrgyz RepublicLao PDRLate-demographic dividendLatin America & Caribbean Latin America & Caribbean (excluding high income)Latin America & the Caribbean (IDA & IBRD countries)LatviaLeast developed countries: UN classificationLebanonLesothoLiberiaLibyaLiechtensteinLithuaniaLow & middle incomeLow incomeLower middle incomeLuxembourgMacao SAR, ChinaMacedonia, FYRMadagascarMalawiMalaysiaMaldivesMaliMaltaMarshall IslandsMauritaniaMauritiusMexicoMicronesia, Fed. Sts.Middle East & North AfricaMiddle East & North Africa (excluding high income)Middle East & North Africa (IDA & IBRD countries)Middle incomeMoldovaMonacoMongoliaMontenegroMoroccoMozambiqueMyanmarNamibiaNauruNepalNetherlandsNew CaledoniaNew ZealandNicaraguaNigerNigeriaNorth AmericaNorwayOECD membersOmanOther small statesPacific island small statesPakistanPalauPanamaPapua New GuineaParaguayPeruPhilippinesPolandPortugalPost-demographic dividendPre-demographic dividendPuerto RicoQatarRomaniaRussian FederationRwandaSamoaSan MarinoSao Tome and PrincipeSaudi ArabiaSenegalSerbiaSeychellesSierra LeoneSingaporeSlovak RepublicSloveniaSmall statesSolomon IslandsSouth AfricaSouth AsiaSouth Asia (IDA & IBRD)South SudanSpainSri LankaSt. Kitts and NevisSt. LuciaSt. Vincent and the GrenadinesSub-Saharan Africa Sub-Saharan Africa (excluding high income)Sub-Saharan Africa (IDA & IBRD countries)SudanSurinameSwazilandSwedenSwitzerlandSyrian Arab RepublicTajikistanTanzaniaThailandTimor-LesteTogoTongaTrinidad and TobagoTunisiaTurkeyTurkmenistanTuvaluUgandaUkraineUnited Arab EmiratesUnited KingdomUnited StatesUpper middle incomeUruguayUzbekistanVanuatuVenezuela, RBVietnamVirgin Islands (U.S.)West Bank and GazaWorldYemen, Rep.ZambiaZimbabwe Timeline:
This timeline shows a graph from 1963 to 2016 of World. No data until 1962. Number of actual observations by date: 54.
Source name:
World Development Indicators
Source organization:
World Bank national accounts data, and OECD National Accounts data files.
Categories, topics:
Economy & Growth
Last updated:
apr 23, 2017
Indicators value changes by year
Minimum:
500.42
jan 1, 1963
Maximum:
10.898K
jan 1, 2015
At the date of observation
Value
Absolute change
Change from previous value
jan 1, 1963
500.42
+500.42
0.0%
jan 1, 1964
527.299
+26.879
5.37%
jan 1, 1965
564.405
+37.106
7.04%
jan 1, 1966
607.391
+42.986
7.62%
jan 1, 1967
651.81
+44.419
7.31%
jan 1, 1968
680.626
+28.816
4.42%
jan 1, 1969
730.558
+49.932
7.34%
jan 1, 1970
787.842
+57.284
7.84%
jan 1, 1971
839.349
+51.506
6.54%
jan 1, 1972
900.154
+60.806
7.24%
jan 1, 1973
1.003K
+103.214
11.47%
jan 1, 1974
1.208K
+204.449
20.38%
jan 1, 1975
1.415K
+207.486
17.18%
jan 1, 1976
1.587K
+171.76
12.14%
jan 1, 1977
1.667K
+80.181
5.05%
jan 1, 1978
1.764K
+97.093
5.82%
jan 1, 1979
1.979K
+214.254
12.14%
jan 1, 1980
2.335K
+356.385
18.01%
jan 1, 1981
2.673K
+337.891
14.47%
jan 1, 1982
2.783K
+110.404
4.13%
jan 1, 1983
2.642K
-141.196
-5.07%
jan 1, 1984
2.455K
-186.665
-7.07%
jan 1, 1985
2.484K
+28.981
1.18%
jan 1, 1986
2.572K
+88.056
3.54%
jan 1, 1987
2.835K
+262.061
10.19%
jan 1, 1988
3.306K
+471.892
16.65%
jan 1, 1989
3.908K
+601.866
18.2%
jan 1, 1990
4.064K
+155.532
3.98%
jan 1, 1991
4.219K
+155.453
3.83%
jan 1, 1992
4.367K
+147.94
3.51%
jan 1, 1993
4.683K
+315.986
7.24%
jan 1, 1994
4.743K
+60.092
1.28%
jan 1, 1995
4.932K
+188.546
3.98%
jan 1, 1996
5.229K
+297.384
6.03%
jan 1, 1997
5.485K
+255.364
4.88%
jan 1, 1998
5.528K
+43.295
0.79%
jan 1, 1999
5.293K
-234.868
-4.25%
jan 1, 2000
5.298K
+4.645
0.09%
jan 1, 2001
5.479K
+181.505
3.43%
jan 1, 2002
5.453K
-26.633
-0.49%
jan 1, 2003
5.409K
-43.138
-0.79%
jan 1, 2004
5.813K
+403.244
7.45%
jan 1, 2005
6.629K
+816.125
14.04%
jan 1, 2006
7.347K
+718.401
10.84%
jan 1, 2007
7.833K
+485.858
6.61%
jan 1, 2008
8.347K
+513.978
6.56%
jan 1, 2009
8.937K
+589.584
7.06%
jan 1, 2010
8.963K
+25.952
0.29%
jan 1, 2011
9.39K
+427.979
4.78%
jan 1, 2012
9.868K
+477.626
5.09%
jan 1, 2013
10.446K
+577.913
5.86%
jan 1, 2014
10.799K
+352.588
3.38%
jan 1, 2015
10.898K
+99.836
0.92%
jan 1, 2016
10.548K
-350.878
-3.22%
Ranking of countries by current statistics by years


Comments: