29
/
en
AIzaSyAYiBZKx7MnpbEhh9jyipgxe19OcubqV5w
April 1, 2024
52626
OECD members
OED
false
2
1
GNI per capita, Atlas method (current US$)
2016,2015,2014,2013,2012,2011,2010,2009,2008,2007,2006,2005,2004,2003,2002,2001,2000,1999,1998,1997,1996,1995,1994,1993,1992,1991,1990,1989,1988,1987,1986,1985,1984,1983,1982,1981,1980,1979,1978,1977,1976,1975,1974,1973,1972,1971,1970,1969,1968,1967,1966,1965,1964,1963
This statistics in other country:
AfghanistanAlbaniaAlgeriaAndorraAngolaAntigua and BarbudaArab WorldArgentinaArmeniaAustraliaAustriaAzerbaijanBahamas, TheBahrainBangladeshBarbadosBelarusBelgiumBelizeBeninBermudaBhutanBoliviaBosnia and HerzegovinaBotswanaBrazilBrunei DarussalamBulgariaBurkina FasoBurundiCabo VerdeCambodiaCameroonCanadaCaribbean small statesCentral African RepublicCentral Europe and the BalticsChadChannel IslandsChileChinaColombiaComorosCongo, Dem. Rep.Congo, Rep.Costa RicaCote d'IvoireCroatiaCubaCyprusCzech RepublicDenmarkDjiboutiDominicaDominican RepublicEarly-demographic dividendEast Asia & PacificEast Asia & Pacific (excluding high income)East Asia & Pacific (IDA & IBRD countries)EcuadorEgypt, Arab Rep.El SalvadorEquatorial GuineaEritreaEstoniaEthiopiaEuro areaEurope & Central AsiaEurope & Central Asia (excluding high income)Europe & Central Asia (IDA & IBRD countries)European UnionFijiFinlandFragile and conflict affected situationsFranceFrench PolynesiaGabonGambia, TheGeorgiaGermanyGhanaGreeceGreenlandGrenadaGuatemalaGuineaGuinea-BissauGuyanaHaitiHeavily indebted poor countries (HIPC)High incomeHondurasHong Kong SAR, ChinaHungaryIBRD onlyIcelandIDA & IBRD totalIDA blendIDA onlyIDA totalIndiaIndonesiaIran, Islamic Rep.IraqIrelandIsle of ManIsraelItalyJamaicaJapanJordanKazakhstanKenyaKiribatiKorea, Rep.KosovoKuwaitKyrgyz RepublicLao PDRLate-demographic dividendLatin America & Caribbean Latin America & Caribbean (excluding high income)Latin America & the Caribbean (IDA & IBRD countries)LatviaLeast developed countries: UN classificationLebanonLesothoLiberiaLibyaLiechtensteinLithuaniaLow & middle incomeLow incomeLower middle incomeLuxembourgMacao SAR, ChinaMacedonia, FYRMadagascarMalawiMalaysiaMaldivesMaliMaltaMarshall IslandsMauritaniaMauritiusMexicoMicronesia, Fed. Sts.Middle East & North AfricaMiddle East & North Africa (excluding high income)Middle East & North Africa (IDA & IBRD countries)Middle incomeMoldovaMonacoMongoliaMontenegroMoroccoMozambiqueMyanmarNamibiaNauruNepalNetherlandsNew CaledoniaNew ZealandNicaraguaNigerNigeriaNorth AmericaNorwayOECD membersOmanOther small statesPacific island small statesPakistanPalauPanamaPapua New GuineaParaguayPeruPhilippinesPolandPortugalPost-demographic dividendPre-demographic dividendPuerto RicoQatarRomaniaRussian FederationRwandaSamoaSan MarinoSao Tome and PrincipeSaudi ArabiaSenegalSerbiaSeychellesSierra LeoneSingaporeSlovak RepublicSloveniaSmall statesSolomon IslandsSouth AfricaSouth AsiaSouth Asia (IDA & IBRD)South SudanSpainSri LankaSt. Kitts and NevisSt. LuciaSt. Vincent and the GrenadinesSub-Saharan Africa Sub-Saharan Africa (excluding high income)Sub-Saharan Africa (IDA & IBRD countries)SudanSurinameSwazilandSwedenSwitzerlandSyrian Arab RepublicTajikistanTanzaniaThailandTimor-LesteTogoTongaTrinidad and TobagoTunisiaTurkeyTurkmenistanTuvaluUgandaUkraineUnited Arab EmiratesUnited KingdomUnited StatesUpper middle incomeUruguayUzbekistanVanuatuVenezuela, RBVietnamVirgin Islands (U.S.)West Bank and GazaWorldYemen, Rep.ZambiaZimbabwe Timeline:
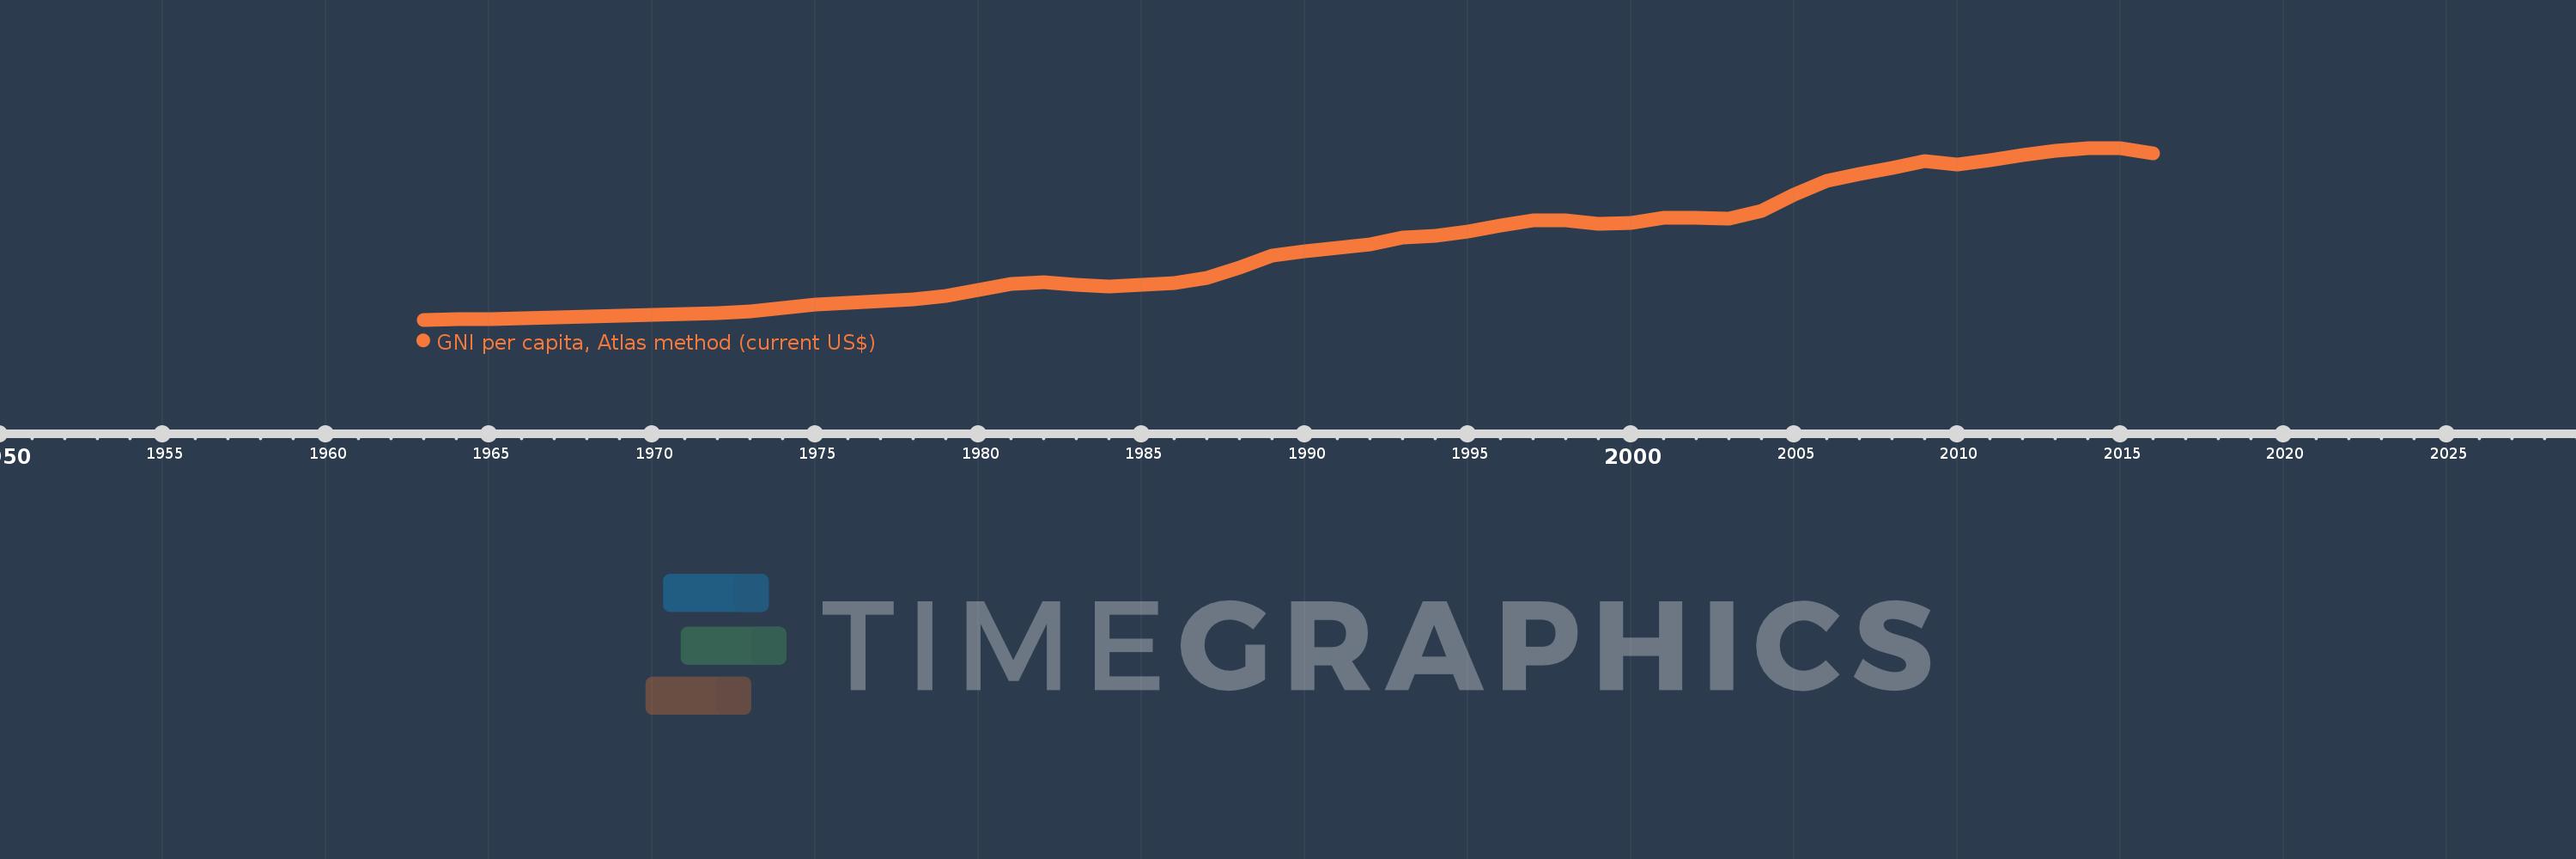
This timeline shows a graph from 1963 to 2016 of OECD members. No data until 1962. Number of actual observations by date: 54.
Source name:
World Development Indicators
Source organization:
World Bank national accounts data, and OECD National Accounts data files.
Categories, topics:
Economy & Growth
Last updated:
apr 23, 2017
Indicators value changes by year
Minimum:
1.484K
jan 1, 1963
Maximum:
39.109K
jan 1, 2014
At the date of observation
Value
Absolute change
Change from previous value
jan 1, 1963
1.484K
+1.484K
0.0%
jan 1, 1964
1.569K
+84.795
5.71%
jan 1, 1965
1.685K
+116.304
7.41%
jan 1, 1966
1.826K
+140.344
8.33%
jan 1, 1967
1.989K
+162.945
8.92%
jan 1, 1968
2.113K
+124.245
6.25%
jan 1, 1969
2.315K
+202.283
9.57%
jan 1, 1970
2.512K
+196.429
8.48%
jan 1, 1971
2.687K
+175.255
6.98%
jan 1, 1972
2.915K
+228.331
8.5%
jan 1, 1973
3.323K
+407.387
13.97%
jan 1, 1974
4.052K
+729.472
21.95%
jan 1, 1975
4.725K
+672.702
16.6%
jan 1, 1976
5.279K
+553.727
11.72%
jan 1, 1977
5.576K
+297.212
5.63%
jan 1, 1978
5.958K
+381.997
6.85%
jan 1, 1979
6.781K
+823.551
13.82%
jan 1, 1980
8.099K
+1.318K
19.43%
jan 1, 1981
9.328K
+1.229K
15.18%
jan 1, 1982
9.708K
+379.596
4.07%
jan 1, 1983
9.22K
-487.703
-5.02%
jan 1, 1984
8.82K
-400.24
-4.34%
jan 1, 1985
9.133K
+313.53
3.55%
jan 1, 1986
9.577K
+443.263
4.85%
jan 1, 1987
10.737K
+1.16K
12.12%
jan 1, 1988
12.84K
+2.103K
19.59%
jan 1, 1989
15.606K
+2.766K
21.54%
jan 1, 1990
16.457K
+850.797
5.45%
jan 1, 1991
17.243K
+785.668
4.77%
jan 1, 1992
17.913K
+670.58
3.89%
jan 1, 1993
19.414K
+1.5K
8.38%
jan 1, 1994
19.894K
+480.415
2.47%
jan 1, 1995
20.875K
+980.479
4.93%
jan 1, 1996
22.183K
+1.308K
6.27%
jan 1, 1997
23.198K
+1.015K
4.57%
jan 1, 1998
23.278K
+80.888
0.35%
jan 1, 1999
22.462K
-816.493
-3.51%
jan 1, 2000
22.76K
+298.345
1.33%
jan 1, 2001
23.754K
+993.995
4.37%
jan 1, 2002
23.723K
-31.502
-0.13%
jan 1, 2003
23.593K
-130.315
-0.55%
jan 1, 2004
25.403K
+1.81K
7.67%
jan 1, 2005
28.987K
+3.584K
14.11%
jan 1, 2006
31.921K
+2.934K
10.12%
jan 1, 2007
33.482K
+1.562K
4.89%
jan 1, 2008
34.756K
+1.274K
3.81%
jan 1, 2009
36.205K
+1.449K
4.17%
jan 1, 2010
35.513K
-692.841
-1.91%
jan 1, 2011
36.365K
+852.469
2.4%
jan 1, 2012
37.466K
+1.101K
3.03%
jan 1, 2013
38.55K
+1.084K
2.89%
jan 1, 2014
39.109K
+559.618
1.45%
jan 1, 2015
39.098K
-11.724
-0.03%
jan 1, 2016
37.907K
-1.191K
-3.05%
Ranking of countries by current statistics by years


Comments: