29
/
en
AIzaSyAYiBZKx7MnpbEhh9jyipgxe19OcubqV5w
April 1, 2024
36587
IBRD only
IBD
false
2
1
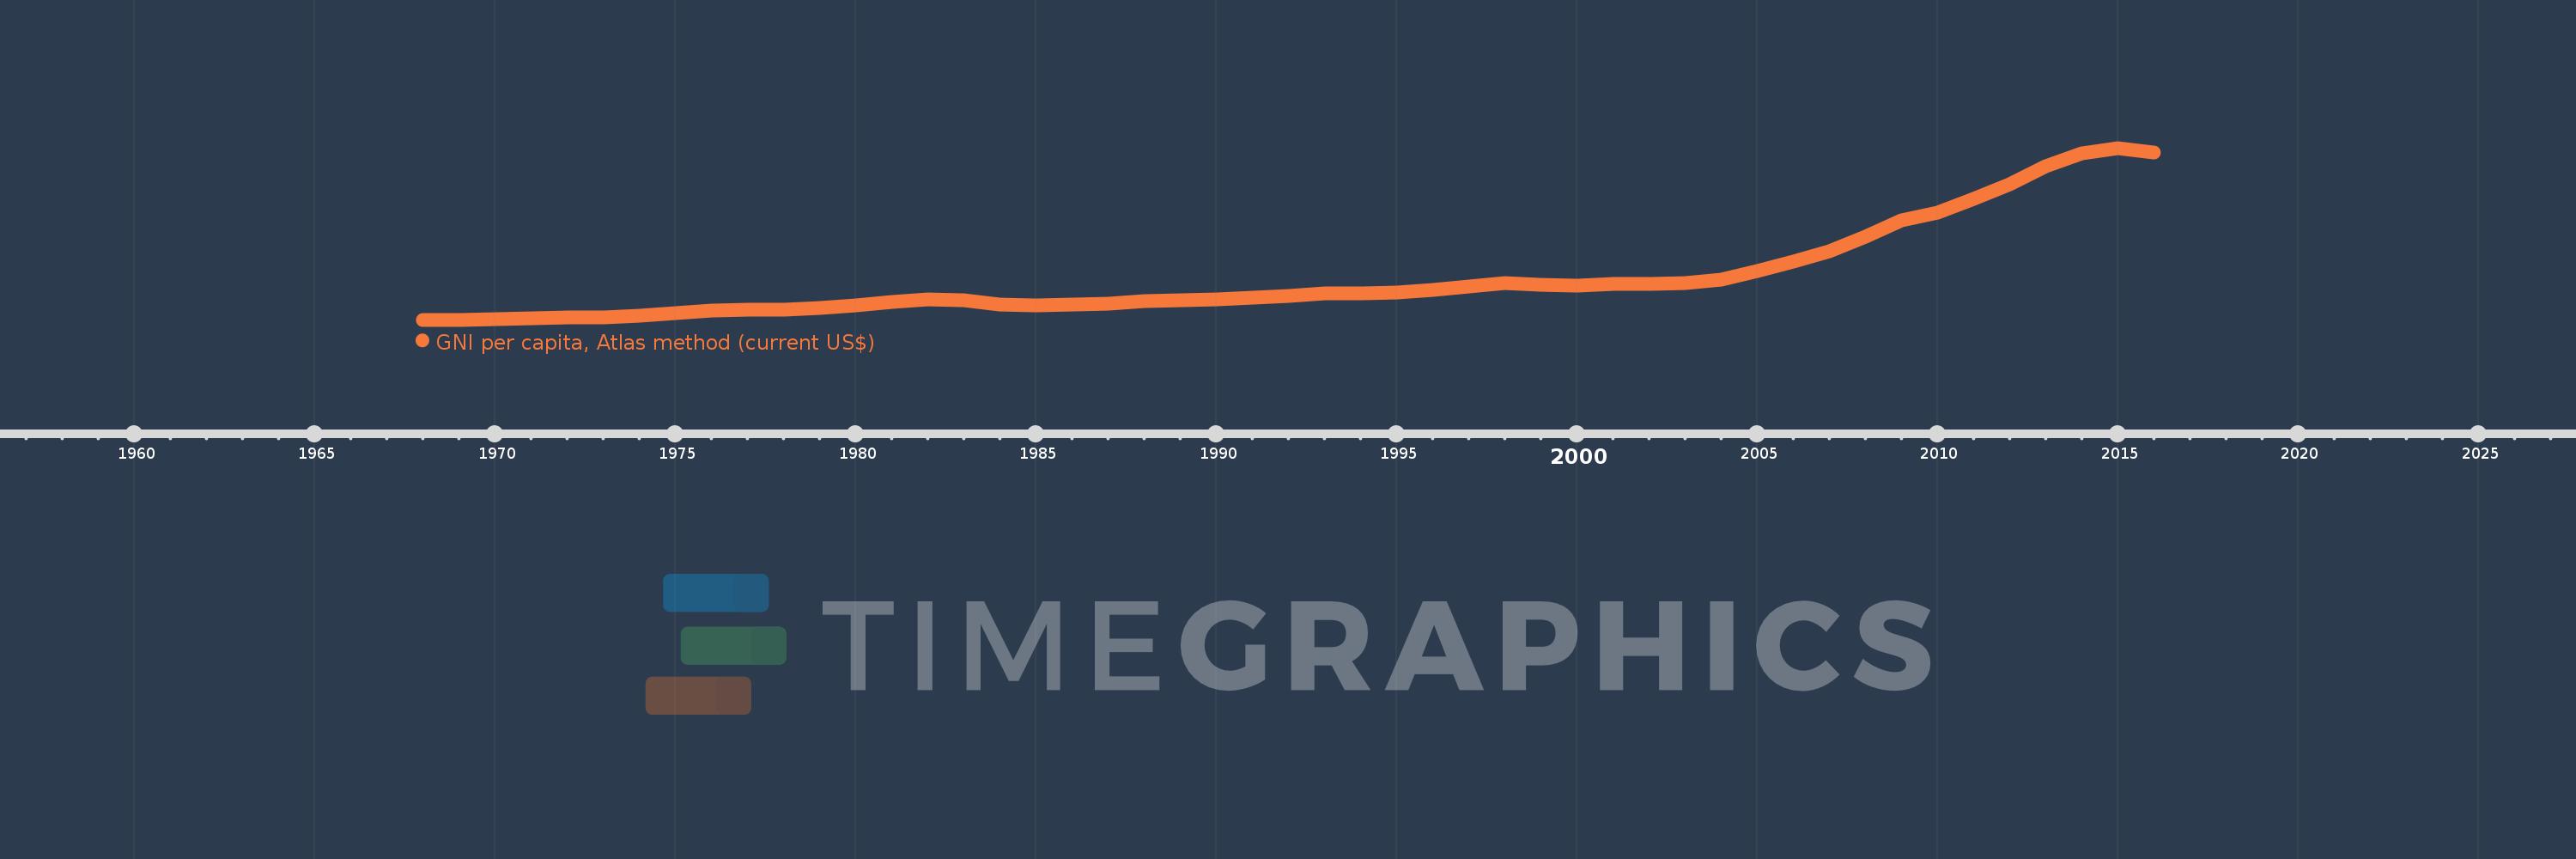
GNI per capita, Atlas method (current US$)
2016,2015,2014,2013,2012,2011,2010,2009,2008,2007,2006,2005,2004,2003,2002,2001,2000,1999,1998,1997,1996,1995,1994,1993,1992,1991,1990,1989,1988,1987,1986,1985,1984,1983,1982,1981,1980,1979,1978,1977,1976,1975,1974,1973,1972,1971,1970,1969,1968
This statistics in other country:
AfghanistanAlbaniaAlgeriaAndorraAngolaAntigua and BarbudaArab WorldArgentinaArmeniaAustraliaAustriaAzerbaijanBahamas, TheBahrainBangladeshBarbadosBelarusBelgiumBelizeBeninBermudaBhutanBoliviaBosnia and HerzegovinaBotswanaBrazilBrunei DarussalamBulgariaBurkina FasoBurundiCabo VerdeCambodiaCameroonCanadaCaribbean small statesCentral African RepublicCentral Europe and the BalticsChadChannel IslandsChileChinaColombiaComorosCongo, Dem. Rep.Congo, Rep.Costa RicaCote d'IvoireCroatiaCubaCyprusCzech RepublicDenmarkDjiboutiDominicaDominican RepublicEarly-demographic dividendEast Asia & PacificEast Asia & Pacific (excluding high income)East Asia & Pacific (IDA & IBRD countries)EcuadorEgypt, Arab Rep.El SalvadorEquatorial GuineaEritreaEstoniaEthiopiaEuro areaEurope & Central AsiaEurope & Central Asia (excluding high income)Europe & Central Asia (IDA & IBRD countries)European UnionFijiFinlandFragile and conflict affected situationsFranceFrench PolynesiaGabonGambia, TheGeorgiaGermanyGhanaGreeceGreenlandGrenadaGuatemalaGuineaGuinea-BissauGuyanaHaitiHeavily indebted poor countries (HIPC)High incomeHondurasHong Kong SAR, ChinaHungaryIBRD onlyIcelandIDA & IBRD totalIDA blendIDA onlyIDA totalIndiaIndonesiaIran, Islamic Rep.IraqIrelandIsle of ManIsraelItalyJamaicaJapanJordanKazakhstanKenyaKiribatiKorea, Rep.KosovoKuwaitKyrgyz RepublicLao PDRLate-demographic dividendLatin America & Caribbean Latin America & Caribbean (excluding high income)Latin America & the Caribbean (IDA & IBRD countries)LatviaLeast developed countries: UN classificationLebanonLesothoLiberiaLibyaLiechtensteinLithuaniaLow & middle incomeLow incomeLower middle incomeLuxembourgMacao SAR, ChinaMacedonia, FYRMadagascarMalawiMalaysiaMaldivesMaliMaltaMarshall IslandsMauritaniaMauritiusMexicoMicronesia, Fed. Sts.Middle East & North AfricaMiddle East & North Africa (excluding high income)Middle East & North Africa (IDA & IBRD countries)Middle incomeMoldovaMonacoMongoliaMontenegroMoroccoMozambiqueMyanmarNamibiaNauruNepalNetherlandsNew CaledoniaNew ZealandNicaraguaNigerNigeriaNorth AmericaNorwayOECD membersOmanOther small statesPacific island small statesPakistanPalauPanamaPapua New GuineaParaguayPeruPhilippinesPolandPortugalPost-demographic dividendPre-demographic dividendPuerto RicoQatarRomaniaRussian FederationRwandaSamoaSan MarinoSao Tome and PrincipeSaudi ArabiaSenegalSerbiaSeychellesSierra LeoneSingaporeSlovak RepublicSloveniaSmall statesSolomon IslandsSouth AfricaSouth AsiaSouth Asia (IDA & IBRD)South SudanSpainSri LankaSt. Kitts and NevisSt. LuciaSt. Vincent and the GrenadinesSub-Saharan Africa Sub-Saharan Africa (excluding high income)Sub-Saharan Africa (IDA & IBRD countries)SudanSurinameSwazilandSwedenSwitzerlandSyrian Arab RepublicTajikistanTanzaniaThailandTimor-LesteTogoTongaTrinidad and TobagoTunisiaTurkeyTurkmenistanTuvaluUgandaUkraineUnited Arab EmiratesUnited KingdomUnited StatesUpper middle incomeUruguayUzbekistanVanuatuVenezuela, RBVietnamVirgin Islands (U.S.)West Bank and GazaWorldYemen, Rep.ZambiaZimbabwe Timeline:
This timeline shows a graph from 1968 to 2016 of IBRD only. No data until 1967. Number of actual observations by date: 49.
Source name:
World Development Indicators
Source organization:
World Bank national accounts data, and OECD National Accounts data files.
Categories, topics:
Economy & Growth
Last updated:
apr 23, 2017
Indicators value changes by year
Minimum:
250.503
jan 1, 1968
Maximum:
5.954K
jan 1, 2015
At the date of observation
Value
Absolute change
Change from previous value
jan 1, 1968
250.503
+250.503
0.0%
jan 1, 1969
253.665
+3.162
1.26%
jan 1, 1970
275.922
+22.256
8.77%
jan 1, 1971
299.436
+23.515
8.52%
jan 1, 1972
313.528
+14.092
4.71%
jan 1, 1973
321.507
+7.979
2.54%
jan 1, 1974
379.239
+57.732
17.96%
jan 1, 1975
473.022
+93.783
24.73%
jan 1, 1976
556.633
+83.611
17.68%
jan 1, 1977
573.951
+17.318
3.11%
jan 1, 1978
594.495
+20.543
3.58%
jan 1, 1979
639.085
+44.591
7.5%
jan 1, 1980
732.669
+93.583
14.64%
jan 1, 1981
848.073
+115.404
15.75%
jan 1, 1982
927.938
+79.865
9.42%
jan 1, 1983
905.954
-21.984
-2.37%
jan 1, 1984
762.266
-143.688
-15.86%
jan 1, 1985
724.295
-37.971
-4.98%
jan 1, 1986
751.147
+26.852
3.71%
jan 1, 1987
792.556
+41.409
5.51%
jan 1, 1988
857.668
+65.112
8.22%
jan 1, 1989
911.81
+54.142
6.31%
jan 1, 1990
925.828
+14.018
1.54%
jan 1, 1991
978.95
+53.122
5.74%
jan 1, 1992
1.052K
+72.99
7.46%
jan 1, 1993
1.112K
+59.747
5.68%
jan 1, 1994
1.119K
+7.264
0.65%
jan 1, 1995
1.159K
+40.174
3.59%
jan 1, 1996
1.245K
+86.31
7.45%
jan 1, 1997
1.367K
+121.887
9.79%
jan 1, 1998
1.455K
+87.591
6.41%
jan 1, 1999
1.407K
-48.155
-3.31%
jan 1, 2000
1.38K
-26.798
-1.9%
jan 1, 2001
1.429K
+49.112
3.56%
jan 1, 2002
1.438K
+9.14
0.64%
jan 1, 2003
1.456K
+17.857
1.24%
jan 1, 2004
1.591K
+135.188
9.28%
jan 1, 2005
1.854K
+263.163
16.54%
jan 1, 2006
2.172K
+317.418
17.12%
jan 1, 2007
2.519K
+347.428
16.0%
jan 1, 2008
3.001K
+481.313
19.11%
jan 1, 2009
3.54K
+538.936
17.96%
jan 1, 2010
3.806K
+265.994
7.51%
jan 1, 2011
4.27K
+464.508
12.21%
jan 1, 2012
4.746K
+475.5
11.14%
jan 1, 2013
5.346K
+600.801
12.66%
jan 1, 2014
5.762K
+415.424
7.77%
jan 1, 2015
5.954K
+191.868
3.33%
jan 1, 2016
5.795K
-158.763
-2.67%
Ranking of countries by current statistics by years


Comments: