29
/
en
AIzaSyAYiBZKx7MnpbEhh9jyipgxe19OcubqV5w
April 1, 2024
34982
Heavily indebted poor countries (HIPC)
HPC
false
2
1
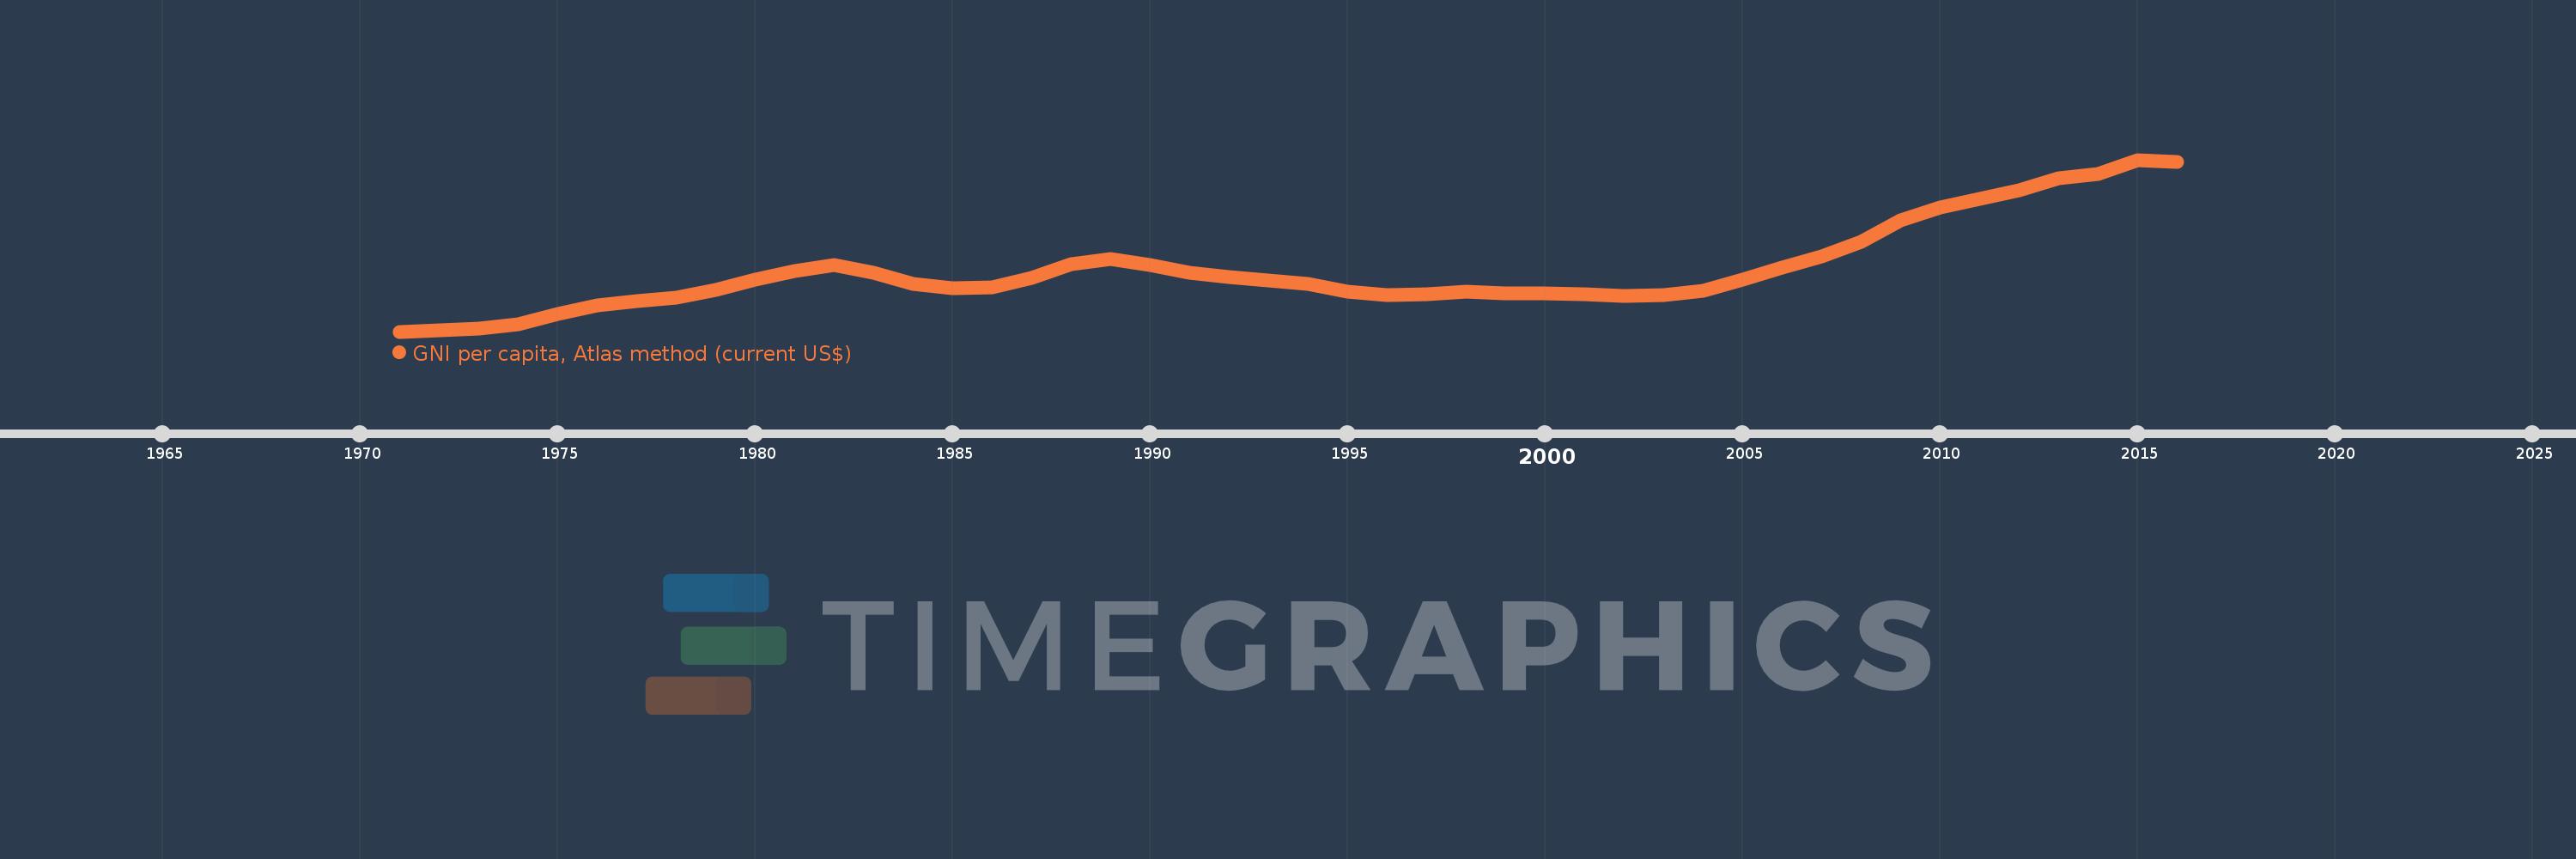
GNI per capita, Atlas method (current US$)
2016,2015,2014,2013,2012,2011,2010,2009,2008,2007,2006,2005,2004,2003,2002,2001,2000,1999,1998,1997,1996,1995,1994,1993,1992,1991,1990,1989,1988,1987,1986,1985,1984,1983,1982,1981,1980,1979,1978,1977,1976,1975,1974,1973,1972,1971
This statistics in other country:
AfghanistanAlbaniaAlgeriaAndorraAngolaAntigua and BarbudaArab WorldArgentinaArmeniaAustraliaAustriaAzerbaijanBahamas, TheBahrainBangladeshBarbadosBelarusBelgiumBelizeBeninBermudaBhutanBoliviaBosnia and HerzegovinaBotswanaBrazilBrunei DarussalamBulgariaBurkina FasoBurundiCabo VerdeCambodiaCameroonCanadaCaribbean small statesCentral African RepublicCentral Europe and the BalticsChadChannel IslandsChileChinaColombiaComorosCongo, Dem. Rep.Congo, Rep.Costa RicaCote d'IvoireCroatiaCubaCyprusCzech RepublicDenmarkDjiboutiDominicaDominican RepublicEarly-demographic dividendEast Asia & PacificEast Asia & Pacific (excluding high income)East Asia & Pacific (IDA & IBRD countries)EcuadorEgypt, Arab Rep.El SalvadorEquatorial GuineaEritreaEstoniaEthiopiaEuro areaEurope & Central AsiaEurope & Central Asia (excluding high income)Europe & Central Asia (IDA & IBRD countries)European UnionFijiFinlandFragile and conflict affected situationsFranceFrench PolynesiaGabonGambia, TheGeorgiaGermanyGhanaGreeceGreenlandGrenadaGuatemalaGuineaGuinea-BissauGuyanaHaitiHeavily indebted poor countries (HIPC)High incomeHondurasHong Kong SAR, ChinaHungaryIBRD onlyIcelandIDA & IBRD totalIDA blendIDA onlyIDA totalIndiaIndonesiaIran, Islamic Rep.IraqIrelandIsle of ManIsraelItalyJamaicaJapanJordanKazakhstanKenyaKiribatiKorea, Rep.KosovoKuwaitKyrgyz RepublicLao PDRLate-demographic dividendLatin America & Caribbean Latin America & Caribbean (excluding high income)Latin America & the Caribbean (IDA & IBRD countries)LatviaLeast developed countries: UN classificationLebanonLesothoLiberiaLibyaLiechtensteinLithuaniaLow & middle incomeLow incomeLower middle incomeLuxembourgMacao SAR, ChinaMacedonia, FYRMadagascarMalawiMalaysiaMaldivesMaliMaltaMarshall IslandsMauritaniaMauritiusMexicoMicronesia, Fed. Sts.Middle East & North AfricaMiddle East & North Africa (excluding high income)Middle East & North Africa (IDA & IBRD countries)Middle incomeMoldovaMonacoMongoliaMontenegroMoroccoMozambiqueMyanmarNamibiaNauruNepalNetherlandsNew CaledoniaNew ZealandNicaraguaNigerNigeriaNorth AmericaNorwayOECD membersOmanOther small statesPacific island small statesPakistanPalauPanamaPapua New GuineaParaguayPeruPhilippinesPolandPortugalPost-demographic dividendPre-demographic dividendPuerto RicoQatarRomaniaRussian FederationRwandaSamoaSan MarinoSao Tome and PrincipeSaudi ArabiaSenegalSerbiaSeychellesSierra LeoneSingaporeSlovak RepublicSloveniaSmall statesSolomon IslandsSouth AfricaSouth AsiaSouth Asia (IDA & IBRD)South SudanSpainSri LankaSt. Kitts and NevisSt. LuciaSt. Vincent and the GrenadinesSub-Saharan Africa Sub-Saharan Africa (excluding high income)Sub-Saharan Africa (IDA & IBRD countries)SudanSurinameSwazilandSwedenSwitzerlandSyrian Arab RepublicTajikistanTanzaniaThailandTimor-LesteTogoTongaTrinidad and TobagoTunisiaTurkeyTurkmenistanTuvaluUgandaUkraineUnited Arab EmiratesUnited KingdomUnited StatesUpper middle incomeUruguayUzbekistanVanuatuVenezuela, RBVietnamVirgin Islands (U.S.)West Bank and GazaWorldYemen, Rep.ZambiaZimbabwe Timeline:
This timeline shows a graph from 1971 to 2016 of Heavily indebted poor countries (HIPC). No data until 1970. Number of actual observations by date: 46.
Source name:
World Development Indicators
Source organization:
World Bank national accounts data, and OECD National Accounts data files.
Categories, topics:
Economy & Growth
Last updated:
apr 23, 2017
Indicators value changes by year
Minimum:
145.17
jan 1, 1971
Maximum:
866.079
jan 1, 2015
At the date of observation
Value
Absolute change
Change from previous value
jan 1, 1971
145.17
+145.17
0.0%
jan 1, 1972
150.463
+5.293
3.65%
jan 1, 1973
157.235
+6.772
4.5%
jan 1, 1974
177.141
+19.906
12.66%
jan 1, 1975
219.945
+42.804
24.16%
jan 1, 1976
256.902
+36.957
16.8%
jan 1, 1977
272.511
+15.609
6.08%
jan 1, 1978
288.81
+16.299
5.98%
jan 1, 1979
319.75
+30.94
10.71%
jan 1, 1980
364.769
+45.018
14.08%
jan 1, 1981
399.527
+34.759
9.53%
jan 1, 1982
424.589
+25.062
6.27%
jan 1, 1983
392.404
-32.185
-7.58%
jan 1, 1984
345.266
-47.138
-12.01%
jan 1, 1985
328.738
-16.529
-4.79%
jan 1, 1986
329.999
+1.261
0.38%
jan 1, 1987
370.372
+40.373
12.23%
jan 1, 1988
428.97
+58.598
15.82%
jan 1, 1989
449.646
+20.676
4.82%
jan 1, 1990
424.987
-24.658
-5.48%
jan 1, 1991
390.99
-33.997
-8.0%
jan 1, 1992
373.955
-17.035
-4.36%
jan 1, 1993
359.852
-14.103
-3.77%
jan 1, 1994
345.709
-14.143
-3.93%
jan 1, 1995
313.369
-32.34
-9.35%
jan 1, 1996
298.3
-15.069
-4.81%
jan 1, 1997
303.02
+4.72
1.58%
jan 1, 1998
311.351
+8.331
2.75%
jan 1, 1999
305.57
-5.781
-1.86%
jan 1, 2000
304.404
-1.166
-0.38%
jan 1, 2001
300.923
-3.48
-1.14%
jan 1, 2002
295.239
-5.684
-1.89%
jan 1, 2003
297.743
+2.504
0.85%
jan 1, 2004
317.508
+19.765
6.64%
jan 1, 2005
364.252
+46.744
14.72%
jan 1, 2006
414.171
+49.92
13.7%
jan 1, 2007
459.568
+45.396
10.96%
jan 1, 2008
522.17
+62.602
13.62%
jan 1, 2009
612.822
+90.652
17.36%
jan 1, 2010
665.996
+53.174
8.68%
jan 1, 2011
702.338
+36.343
5.46%
jan 1, 2012
738.106
+35.767
5.09%
jan 1, 2013
788.637
+50.532
6.85%
jan 1, 2014
805.985
+17.347
2.2%
jan 1, 2015
866.079
+60.094
7.46%
jan 1, 2016
858.473
-7.605
-0.88%
Ranking of countries by current statistics by years


Comments: