29
/
en
AIzaSyAYiBZKx7MnpbEhh9jyipgxe19OcubqV5w
April 1, 2024
39930
IDA total
IDA
false
2
1
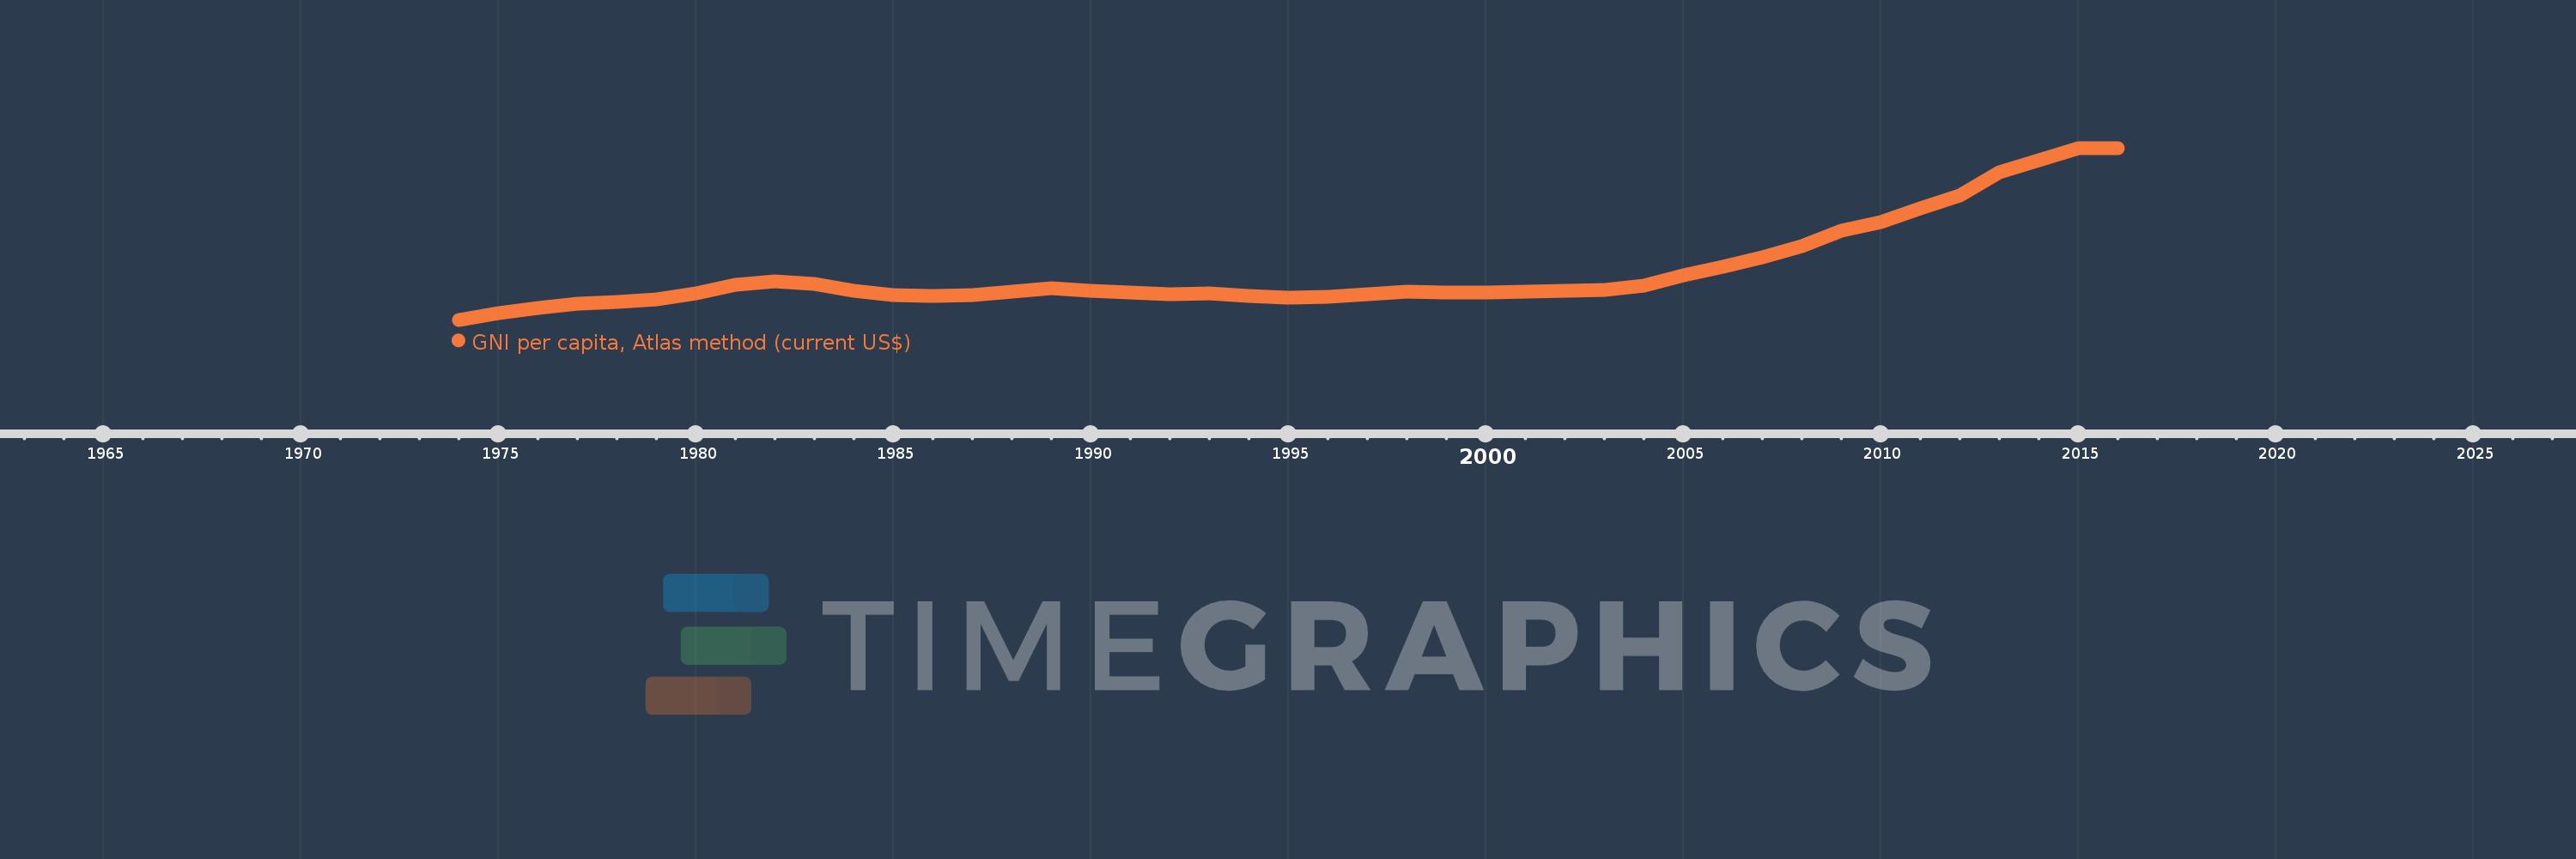
GNI per capita, Atlas method (current US$)
2016,2015,2014,2013,2012,2011,2010,2009,2008,2007,2006,2005,2004,2003,2002,2001,2000,1999,1998,1997,1996,1995,1994,1993,1992,1991,1990,1989,1988,1987,1986,1985,1984,1983,1982,1981,1980,1979,1978,1977,1976,1975,1974
This statistics in other country:
AfghanistanAlbaniaAlgeriaAndorraAngolaAntigua and BarbudaArab WorldArgentinaArmeniaAustraliaAustriaAzerbaijanBahamas, TheBahrainBangladeshBarbadosBelarusBelgiumBelizeBeninBermudaBhutanBoliviaBosnia and HerzegovinaBotswanaBrazilBrunei DarussalamBulgariaBurkina FasoBurundiCabo VerdeCambodiaCameroonCanadaCaribbean small statesCentral African RepublicCentral Europe and the BalticsChadChannel IslandsChileChinaColombiaComorosCongo, Dem. Rep.Congo, Rep.Costa RicaCote d'IvoireCroatiaCubaCyprusCzech RepublicDenmarkDjiboutiDominicaDominican RepublicEarly-demographic dividendEast Asia & PacificEast Asia & Pacific (excluding high income)East Asia & Pacific (IDA & IBRD countries)EcuadorEgypt, Arab Rep.El SalvadorEquatorial GuineaEritreaEstoniaEthiopiaEuro areaEurope & Central AsiaEurope & Central Asia (excluding high income)Europe & Central Asia (IDA & IBRD countries)European UnionFijiFinlandFragile and conflict affected situationsFranceFrench PolynesiaGabonGambia, TheGeorgiaGermanyGhanaGreeceGreenlandGrenadaGuatemalaGuineaGuinea-BissauGuyanaHaitiHeavily indebted poor countries (HIPC)High incomeHondurasHong Kong SAR, ChinaHungaryIBRD onlyIcelandIDA & IBRD totalIDA blendIDA onlyIDA totalIndiaIndonesiaIran, Islamic Rep.IraqIrelandIsle of ManIsraelItalyJamaicaJapanJordanKazakhstanKenyaKiribatiKorea, Rep.KosovoKuwaitKyrgyz RepublicLao PDRLate-demographic dividendLatin America & Caribbean Latin America & Caribbean (excluding high income)Latin America & the Caribbean (IDA & IBRD countries)LatviaLeast developed countries: UN classificationLebanonLesothoLiberiaLibyaLiechtensteinLithuaniaLow & middle incomeLow incomeLower middle incomeLuxembourgMacao SAR, ChinaMacedonia, FYRMadagascarMalawiMalaysiaMaldivesMaliMaltaMarshall IslandsMauritaniaMauritiusMexicoMicronesia, Fed. Sts.Middle East & North AfricaMiddle East & North Africa (excluding high income)Middle East & North Africa (IDA & IBRD countries)Middle incomeMoldovaMonacoMongoliaMontenegroMoroccoMozambiqueMyanmarNamibiaNauruNepalNetherlandsNew CaledoniaNew ZealandNicaraguaNigerNigeriaNorth AmericaNorwayOECD membersOmanOther small statesPacific island small statesPakistanPalauPanamaPapua New GuineaParaguayPeruPhilippinesPolandPortugalPost-demographic dividendPre-demographic dividendPuerto RicoQatarRomaniaRussian FederationRwandaSamoaSan MarinoSao Tome and PrincipeSaudi ArabiaSenegalSerbiaSeychellesSierra LeoneSingaporeSlovak RepublicSloveniaSmall statesSolomon IslandsSouth AfricaSouth AsiaSouth Asia (IDA & IBRD)South SudanSpainSri LankaSt. Kitts and NevisSt. LuciaSt. Vincent and the GrenadinesSub-Saharan Africa Sub-Saharan Africa (excluding high income)Sub-Saharan Africa (IDA & IBRD countries)SudanSurinameSwazilandSwedenSwitzerlandSyrian Arab RepublicTajikistanTanzaniaThailandTimor-LesteTogoTongaTrinidad and TobagoTunisiaTurkeyTurkmenistanTuvaluUgandaUkraineUnited Arab EmiratesUnited KingdomUnited StatesUpper middle incomeUruguayUzbekistanVanuatuVenezuela, RBVietnamVirgin Islands (U.S.)West Bank and GazaWorldYemen, Rep.ZambiaZimbabwe Timeline:
This timeline shows a graph from 1974 to 2016 of IDA total. No data until 1973. Number of actual observations by date: 43.
Source name:
World Development Indicators
Source organization:
World Bank national accounts data, and OECD National Accounts data files.
Categories, topics:
Economy & Growth
Last updated:
apr 23, 2017
Indicators value changes by year
Minimum:
172.414
jan 1, 1974
Maximum:
1.407K
jan 1, 2015
At the date of observation
Value
Absolute change
Change from previous value
jan 1, 1974
172.414
+172.414
0.0%
jan 1, 1975
218.999
+46.585
27.02%
jan 1, 1976
258.512
+39.513
18.04%
jan 1, 1977
285.241
+26.73
10.34%
jan 1, 1978
298.177
+12.936
4.54%
jan 1, 1979
318.101
+19.923
6.68%
jan 1, 1980
364.72
+46.62
14.66%
jan 1, 1981
421.156
+56.436
15.47%
jan 1, 1982
449.305
+28.148
6.68%
jan 1, 1983
431.501
-17.803
-3.96%
jan 1, 1984
380.643
-50.859
-11.79%
jan 1, 1985
350.06
-30.583
-8.03%
jan 1, 1986
344.26
-5.8
-1.66%
jan 1, 1987
348.982
+4.722
1.37%
jan 1, 1988
375.651
+26.67
7.64%
jan 1, 1989
397.773
+22.121
5.89%
jan 1, 1990
382.452
-15.321
-3.85%
jan 1, 1991
366.147
-16.304
-4.26%
jan 1, 1992
358.067
-8.081
-2.21%
jan 1, 1993
358.972
+0.905
0.25%
jan 1, 1994
344.012
-14.959
-4.17%
jan 1, 1995
329.511
-14.502
-4.22%
jan 1, 1996
334.212
+4.701
1.43%
jan 1, 1997
353.841
+19.63
5.87%
jan 1, 1998
371.408
+17.566
4.96%
jan 1, 1999
367.71
-3.697
-1.0%
jan 1, 2000
367.166
-0.544
-0.15%
jan 1, 2001
373.333
+6.167
1.68%
jan 1, 2002
379.162
+5.829
1.56%
jan 1, 2003
387.682
+8.52
2.25%
jan 1, 2004
417.575
+29.893
7.71%
jan 1, 2005
489.552
+71.977
17.24%
jan 1, 2006
550.385
+60.833
12.43%
jan 1, 2007
619.697
+69.312
12.59%
jan 1, 2008
699.517
+79.821
12.88%
jan 1, 2009
812.948
+113.43
16.22%
jan 1, 2010
876.129
+63.181
7.77%
jan 1, 2011
972.623
+96.495
11.01%
jan 1, 2012
1.064K
+91.871
9.45%
jan 1, 2013
1.231K
+166.764
15.67%
jan 1, 2014
1.316K
+85.224
6.92%
jan 1, 2015
1.407K
+90.333
6.86%
jan 1, 2016
1.403K
-4.24
-0.3%
Ranking of countries by current statistics by years


Comments: