29
/
en
AIzaSyAYiBZKx7MnpbEhh9jyipgxe19OcubqV5w
April 1, 2024
178881
Liberia
LBR
true
2
1
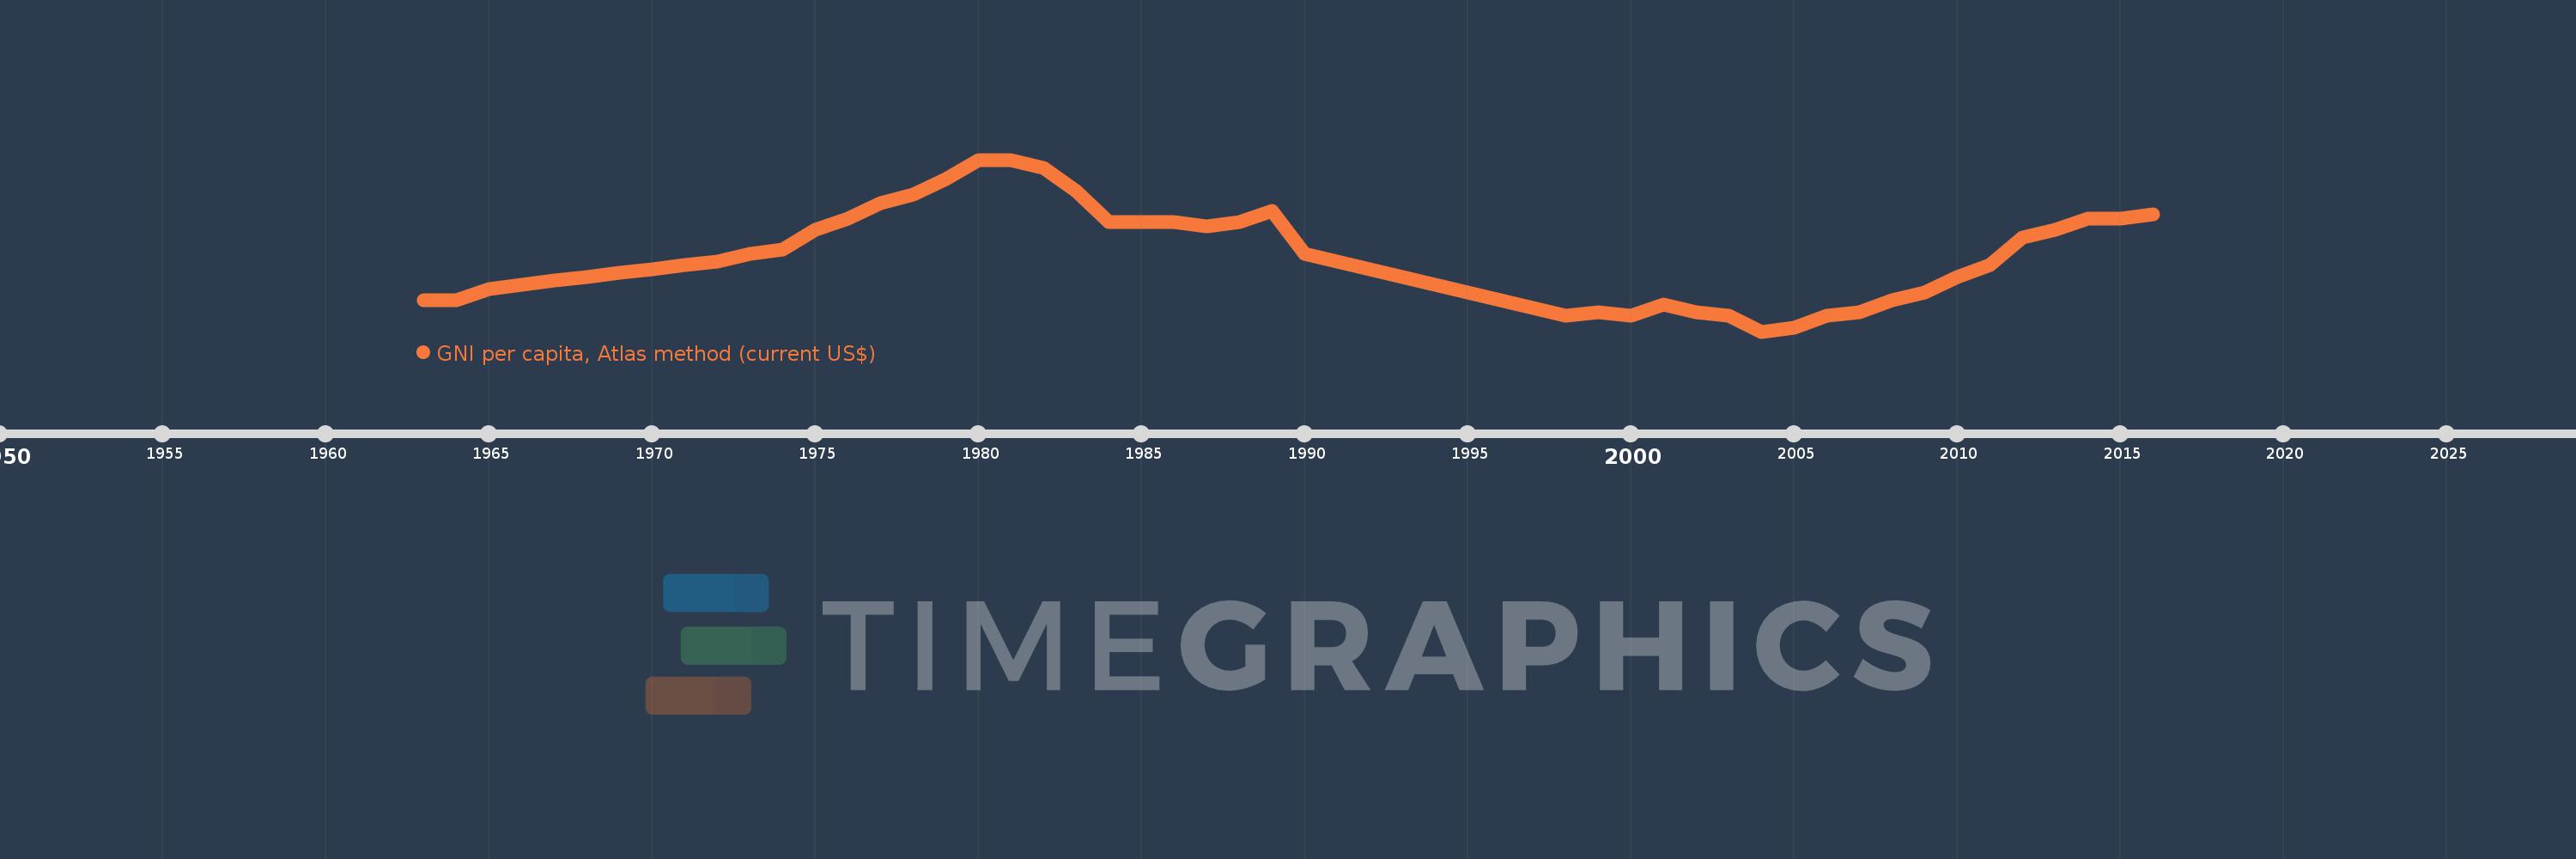
GNI per capita, Atlas method (current US$)
2016,2015,2014,2013,2012,2011,2010,2009,2008,2007,2006,2005,2004,2003,2002,2001,2000,1999,1998,1990,1989,1988,1987,1986,1985,1984,1983,1982,1981,1980,1979,1978,1977,1976,1975,1974,1973,1972,1971,1970,1969,1968,1967,1966,1965,1964,1963
This statistics in other country:
AfghanistanAlbaniaAlgeriaAndorraAngolaAntigua and BarbudaArab WorldArgentinaArmeniaAustraliaAustriaAzerbaijanBahamas, TheBahrainBangladeshBarbadosBelarusBelgiumBelizeBeninBermudaBhutanBoliviaBosnia and HerzegovinaBotswanaBrazilBrunei DarussalamBulgariaBurkina FasoBurundiCabo VerdeCambodiaCameroonCanadaCaribbean small statesCentral African RepublicCentral Europe and the BalticsChadChannel IslandsChileChinaColombiaComorosCongo, Dem. Rep.Congo, Rep.Costa RicaCote d'IvoireCroatiaCubaCyprusCzech RepublicDenmarkDjiboutiDominicaDominican RepublicEarly-demographic dividendEast Asia & PacificEast Asia & Pacific (excluding high income)East Asia & Pacific (IDA & IBRD countries)EcuadorEgypt, Arab Rep.El SalvadorEquatorial GuineaEritreaEstoniaEthiopiaEuro areaEurope & Central AsiaEurope & Central Asia (excluding high income)Europe & Central Asia (IDA & IBRD countries)European UnionFijiFinlandFragile and conflict affected situationsFranceFrench PolynesiaGabonGambia, TheGeorgiaGermanyGhanaGreeceGreenlandGrenadaGuatemalaGuineaGuinea-BissauGuyanaHaitiHeavily indebted poor countries (HIPC)High incomeHondurasHong Kong SAR, ChinaHungaryIBRD onlyIcelandIDA & IBRD totalIDA blendIDA onlyIDA totalIndiaIndonesiaIran, Islamic Rep.IraqIrelandIsle of ManIsraelItalyJamaicaJapanJordanKazakhstanKenyaKiribatiKorea, Rep.KosovoKuwaitKyrgyz RepublicLao PDRLate-demographic dividendLatin America & Caribbean Latin America & Caribbean (excluding high income)Latin America & the Caribbean (IDA & IBRD countries)LatviaLeast developed countries: UN classificationLebanonLesothoLiberiaLibyaLiechtensteinLithuaniaLow & middle incomeLow incomeLower middle incomeLuxembourgMacao SAR, ChinaMacedonia, FYRMadagascarMalawiMalaysiaMaldivesMaliMaltaMarshall IslandsMauritaniaMauritiusMexicoMicronesia, Fed. Sts.Middle East & North AfricaMiddle East & North Africa (excluding high income)Middle East & North Africa (IDA & IBRD countries)Middle incomeMoldovaMonacoMongoliaMontenegroMoroccoMozambiqueMyanmarNamibiaNauruNepalNetherlandsNew CaledoniaNew ZealandNicaraguaNigerNigeriaNorth AmericaNorwayOECD membersOmanOther small statesPacific island small statesPakistanPalauPanamaPapua New GuineaParaguayPeruPhilippinesPolandPortugalPost-demographic dividendPre-demographic dividendPuerto RicoQatarRomaniaRussian FederationRwandaSamoaSan MarinoSao Tome and PrincipeSaudi ArabiaSenegalSerbiaSeychellesSierra LeoneSingaporeSlovak RepublicSloveniaSmall statesSolomon IslandsSouth AfricaSouth AsiaSouth Asia (IDA & IBRD)South SudanSpainSri LankaSt. Kitts and NevisSt. LuciaSt. Vincent and the GrenadinesSub-Saharan Africa Sub-Saharan Africa (excluding high income)Sub-Saharan Africa (IDA & IBRD countries)SudanSurinameSwazilandSwedenSwitzerlandSyrian Arab RepublicTajikistanTanzaniaThailandTimor-LesteTogoTongaTrinidad and TobagoTunisiaTurkeyTurkmenistanTuvaluUgandaUkraineUnited Arab EmiratesUnited KingdomUnited StatesUpper middle incomeUruguayUzbekistanVanuatuVenezuela, RBVietnamVirgin Islands (U.S.)West Bank and GazaWorldYemen, Rep.ZambiaZimbabwe Timeline:
This timeline shows a graph from 1963 to 2016 of Liberia. No data until 1962. Number of actual observations by date: 47.
Source name:
World Development Indicators
Source organization:
World Bank national accounts data, and OECD National Accounts data files.
Categories, topics:
Economy & Growth
Last updated:
apr 23, 2017
Indicators value changes by year
At the date of observation
Value
Absolute change
Change from previous value
jan 1, 1963
160.0
+160.0
0.0%
jan 1, 1964
160.0
0.0
0.0%
jan 1, 1965
190.0
+30.0
18.75%
jan 1, 1966
200.0
+10.0
5.26%
jan 1, 1967
210.0
+10.0
5.0%
jan 1, 1968
220.0
+10.0
4.76%
jan 1, 1969
230.0
+10.0
4.55%
jan 1, 1970
240.0
+10.0
4.35%
jan 1, 1971
250.0
+10.0
4.17%
jan 1, 1972
260.0
+10.0
4.0%
jan 1, 1973
280.0
+20.0
7.69%
jan 1, 1974
290.0
+10.0
3.57%
jan 1, 1975
340.0
+50.0
17.24%
jan 1, 1976
370.0
+30.0
8.82%
jan 1, 1977
410.0
+40.0
10.81%
jan 1, 1978
430.0
+20.0
4.88%
jan 1, 1979
470.0
+40.0
9.3%
jan 1, 1980
520.0
+50.0
10.64%
jan 1, 1981
520.0
0.0
0.0%
jan 1, 1982
500.0
-20.0
-3.85%
jan 1, 1983
440.0
-60.0
-12.0%
jan 1, 1984
360.0
-80.0
-18.18%
jan 1, 1985
360.0
0.0
0.0%
jan 1, 1986
360.0
0.0
0.0%
jan 1, 1987
350.0
-10.0
-2.78%
jan 1, 1988
360.0
+10.0
2.86%
jan 1, 1989
390.0
+30.0
8.33%
jan 1, 1990
280.0
-110.0
-28.21%
jan 1, 1998
120.0
-160.0
-57.14%
jan 1, 1999
130.0
+10.0
8.33%
jan 1, 2000
120.0
-10.0
-7.69%
jan 1, 2001
150.0
+30.0
25.0%
jan 1, 2002
130.0
-20.0
-13.33%
jan 1, 2003
120.0
-10.0
-7.69%
jan 1, 2004
80.0
-40.0
-33.33%
jan 1, 2005
90.0
+10.0
12.5%
jan 1, 2006
120.0
+30.0
33.33%
jan 1, 2007
130.0
+10.0
8.33%
jan 1, 2008
160.0
+30.0
23.08%
jan 1, 2009
180.0
+20.0
12.5%
jan 1, 2010
220.0
+40.0
22.22%
jan 1, 2011
250.0
+30.0
13.64%
jan 1, 2012
320.0
+70.0
28.0%
jan 1, 2013
340.0
+20.0
6.25%
jan 1, 2014
370.0
+30.0
8.82%
jan 1, 2015
370.0
0.0
0.0%
jan 1, 2016
380.0
+10.0
2.7%
Ranking of countries by current statistics by years


Comments: