29
/
en
AIzaSyAYiBZKx7MnpbEhh9jyipgxe19OcubqV5w
April 1, 2024
61888
Upper middle income
UMC
false
2
1
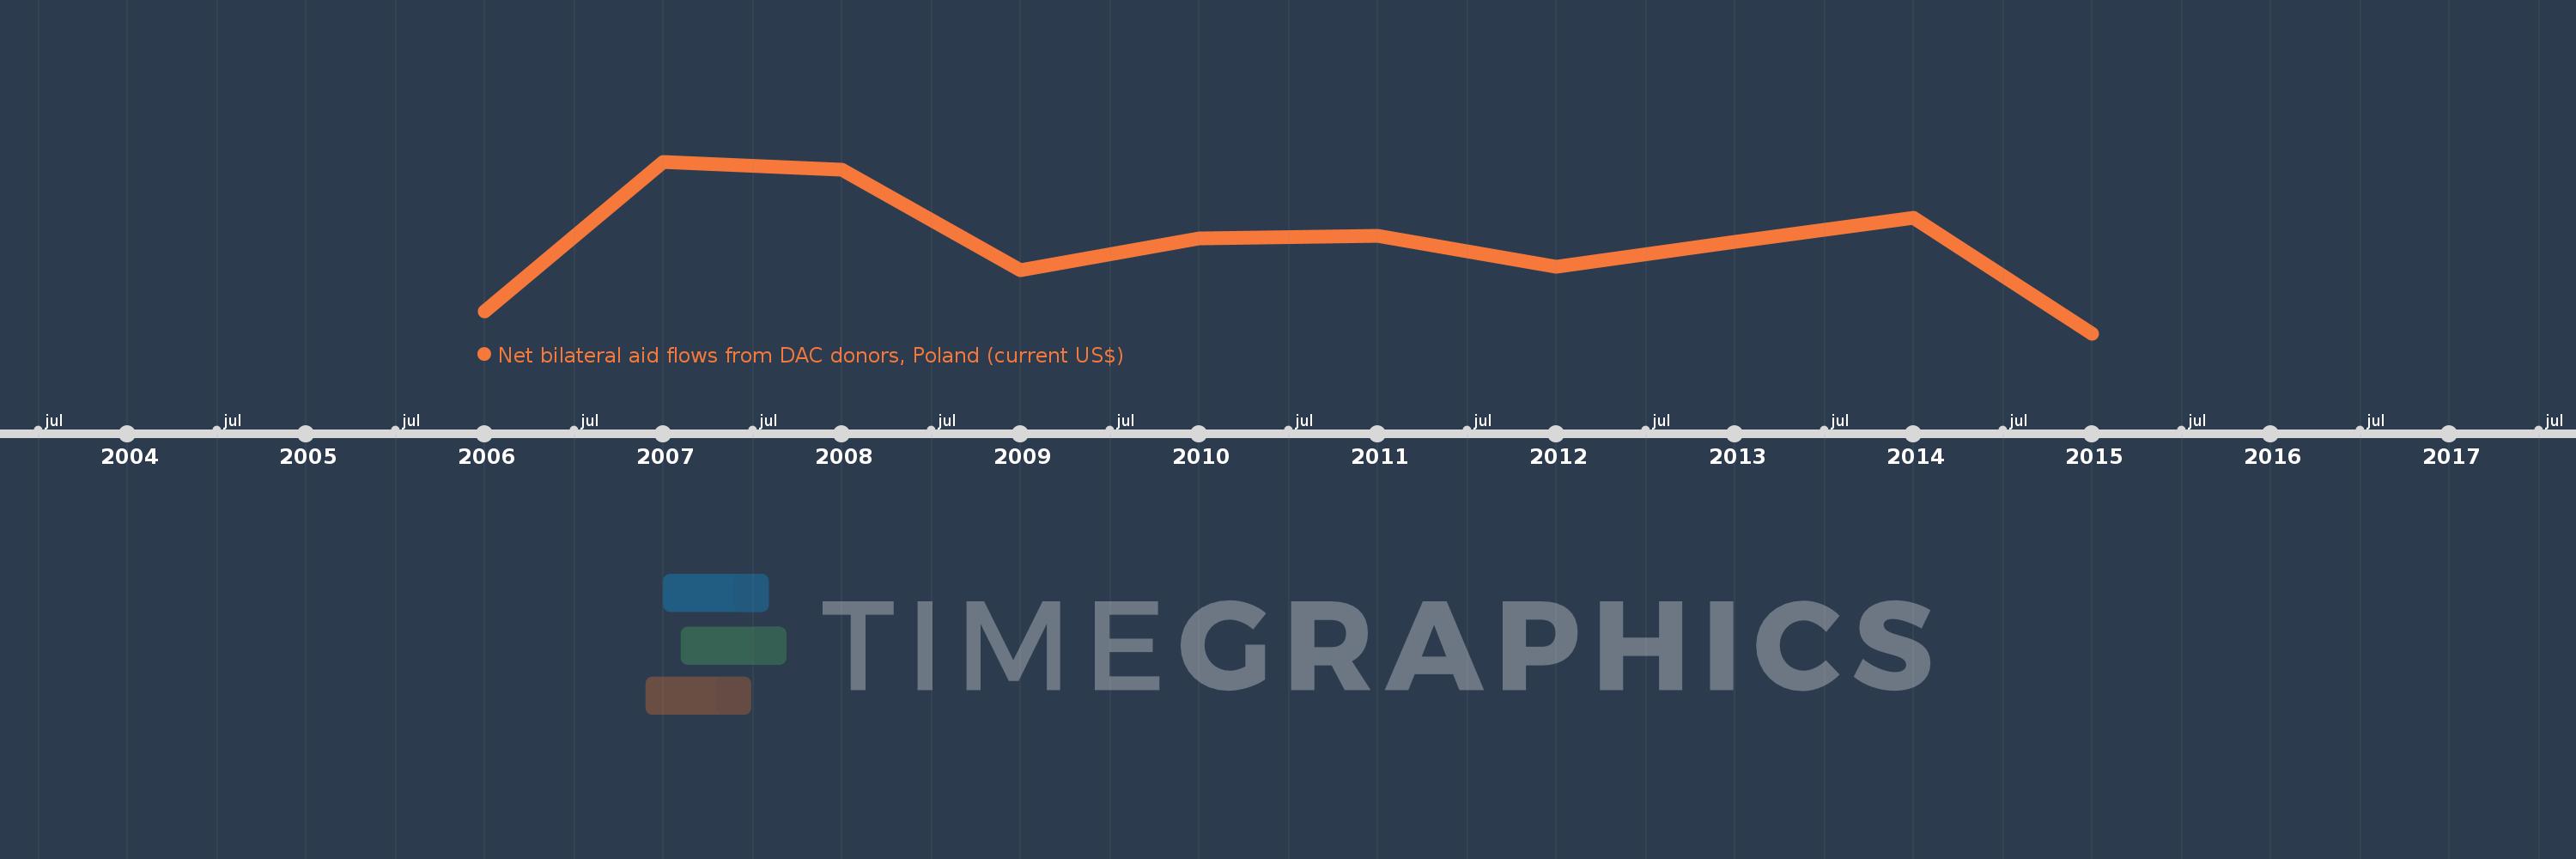
Net bilateral aid flows from DAC donors, Poland (current US$)
2015,2014,2013,2012,2011,2010,2009,2008,2007,2006
This statistics in other country:
Timeline:
This timeline shows a graph from 2006 to 2015 of Upper middle income. No data until 2005. Number of actual observations by date: 10.
Source name:
World Development Indicators
Source organization:
Development Assistance Committee of the Organisation for Economic Co-operation and Development, Geographical Distribution of Financial Flows to Developing Countries, Development Co-operation Report, and International Development Statistics database. Data are available online at: www.oecd.org/dac/stats/idsonline.
Categories, topics:
Aid Effectiveness
Last updated:
apr 23, 2017
Indicators value changes by year
Minimum:
20.56 mln
jan 1, 2015
Maximum:
103.0 mln
jan 1, 2007
At the date of observation
Value
Absolute change
Change from previous value
jan 1, 2006
31.12 mln
+31.12 mln
0.0%
jan 1, 2007
103.0 mln
+71.88 mln
230.98%
jan 1, 2008
99.25 mln
-3.75 mln
-3.64%
jan 1, 2009
50.68 mln
-48.57 mln
-48.94%
jan 1, 2010
66.2 mln
+15.52 mln
30.62%
jan 1, 2011
67.55 mln
+1.35 mln
2.04%
jan 1, 2012
52.48 mln
-15.07 mln
-22.31%
jan 1, 2013
64.48 mln
+12.0 mln
22.87%
jan 1, 2014
76.17 mln
+11.69 mln
18.13%
jan 1, 2015
20.56 mln
-55.61 mln
-73.01%
Ranking of countries by current statistics by years


Comments: