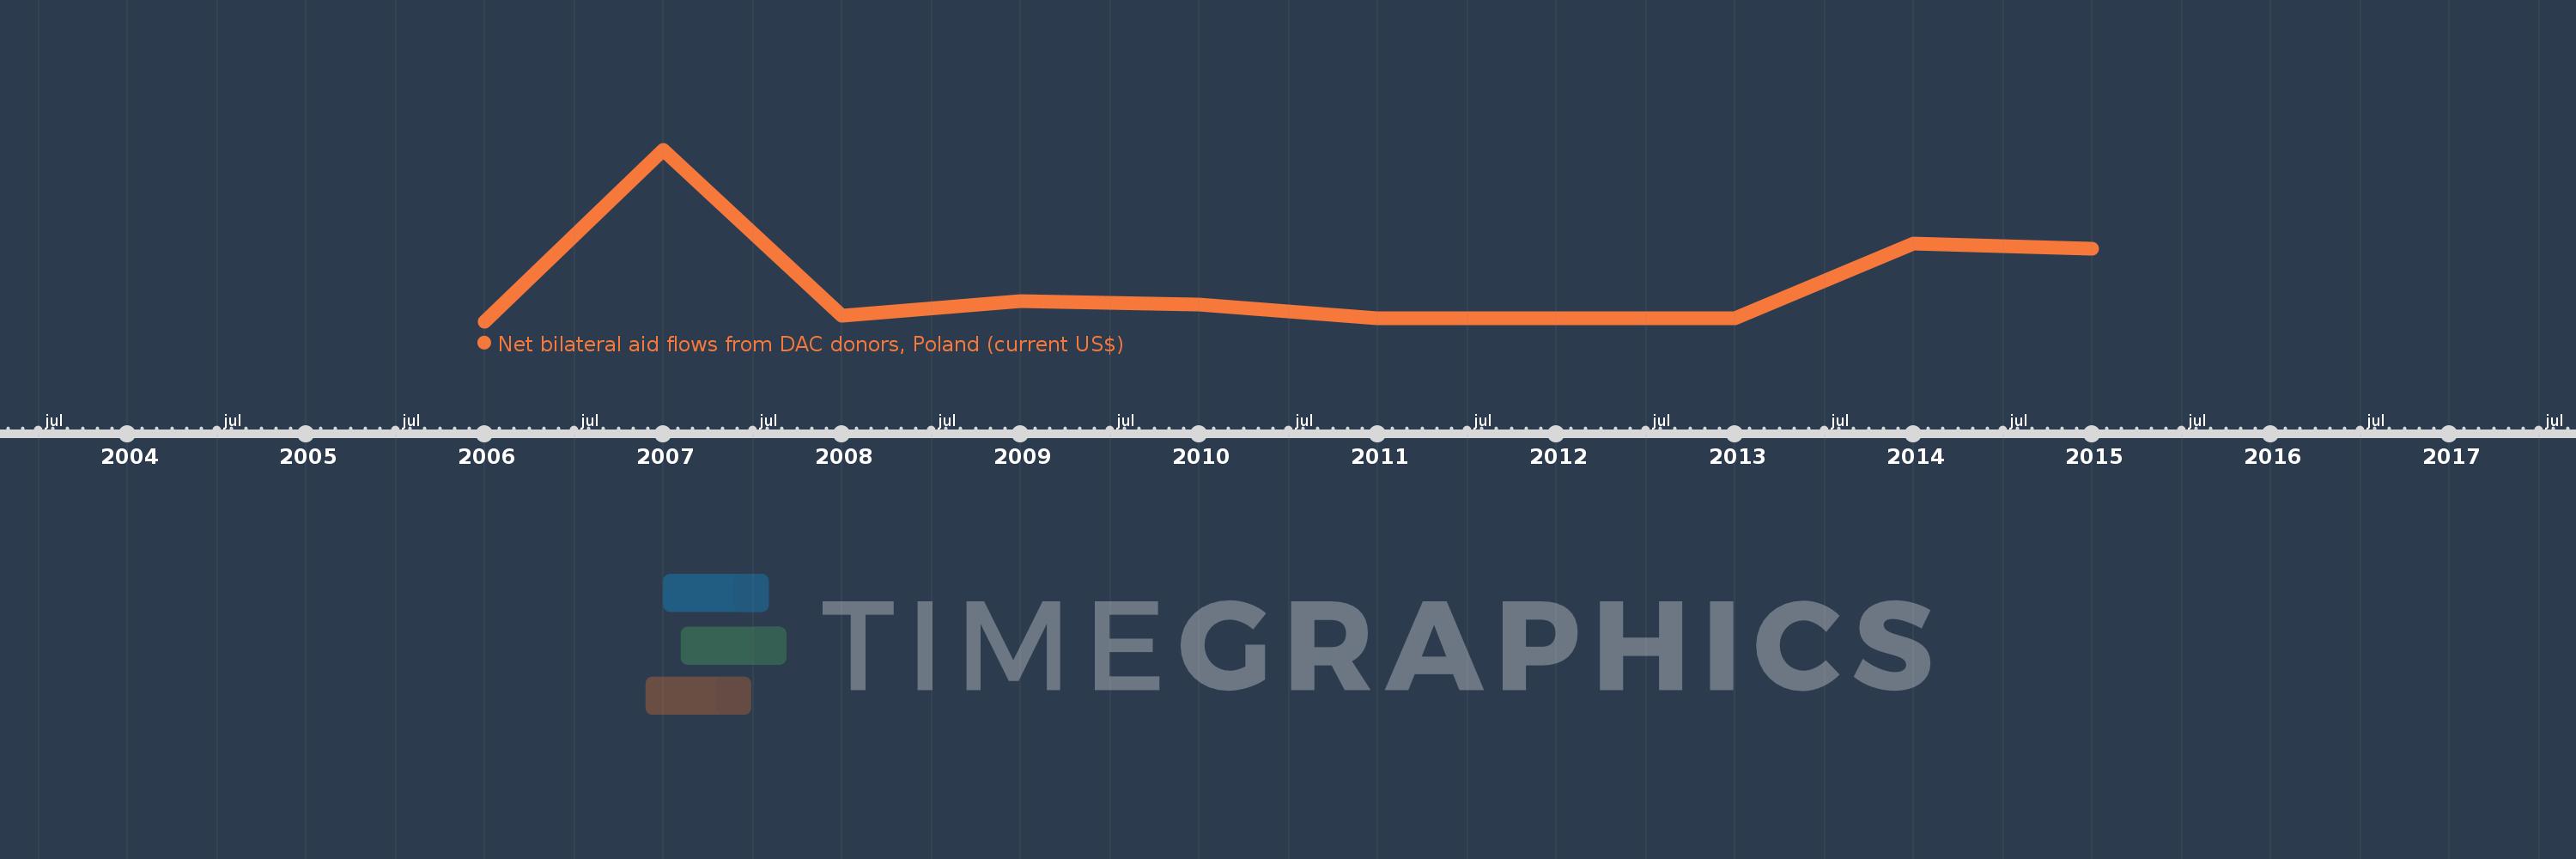
This timeline shows a graph from 2006 to 2015 of Sub-Saharan Africa (IDA & IBRD countries). No data until 2005. Number of actual observations by date: 10.
Source name:
World Development Indicators
Source organization:
Development Assistance Committee of the Organisation for Economic Co-operation and Development, Geographical Distribution of Financial Flows to Developing Countries, Development Co-operation Report, and International Development Statistics database. Data are available online at: www.oecd.org/dac/stats/idsonline.
Categories, topics:
Aid Effectiveness
Last updated:
apr 23, 2017
Indicators value changes by year
Meaning:
21.39 mln
Minimum:
960.0K
jan 1, 2006
Maximum:
93.54 mln
jan 1, 2007
At the date of observation
Value
Absolute change
Change from the previous value
jan 1, 2006
960.0K
+960.0K
0.0%
jan 1, 2007
93.54 mln
+92.58 mln
9.64K%
jan 1, 2008
4.22 mln
-89.32 mln
-95.49%
jan 1, 2009
12.29 mln
+8.07 mln
191.23%
jan 1, 2010
10.36 mln
-1.93 mln
-15.7%
jan 1, 2011
3.0 mln
-7.36 mln
-71.04%
jan 1, 2012
2.84 mln
-160.0K
-5.33%
jan 1, 2013
2.78 mln
-60.0K
-2.11%
jan 1, 2014
43.42 mln
+40.64 mln
1.46K%
jan 1, 2015
40.49 mln
-2.93 mln
-6.75%
Ranking of countries by current statistics by years
