29
/
en
AIzaSyAYiBZKx7MnpbEhh9jyipgxe19OcubqV5w
April 1, 2024
24345
Arab World
ARB
false
2
1
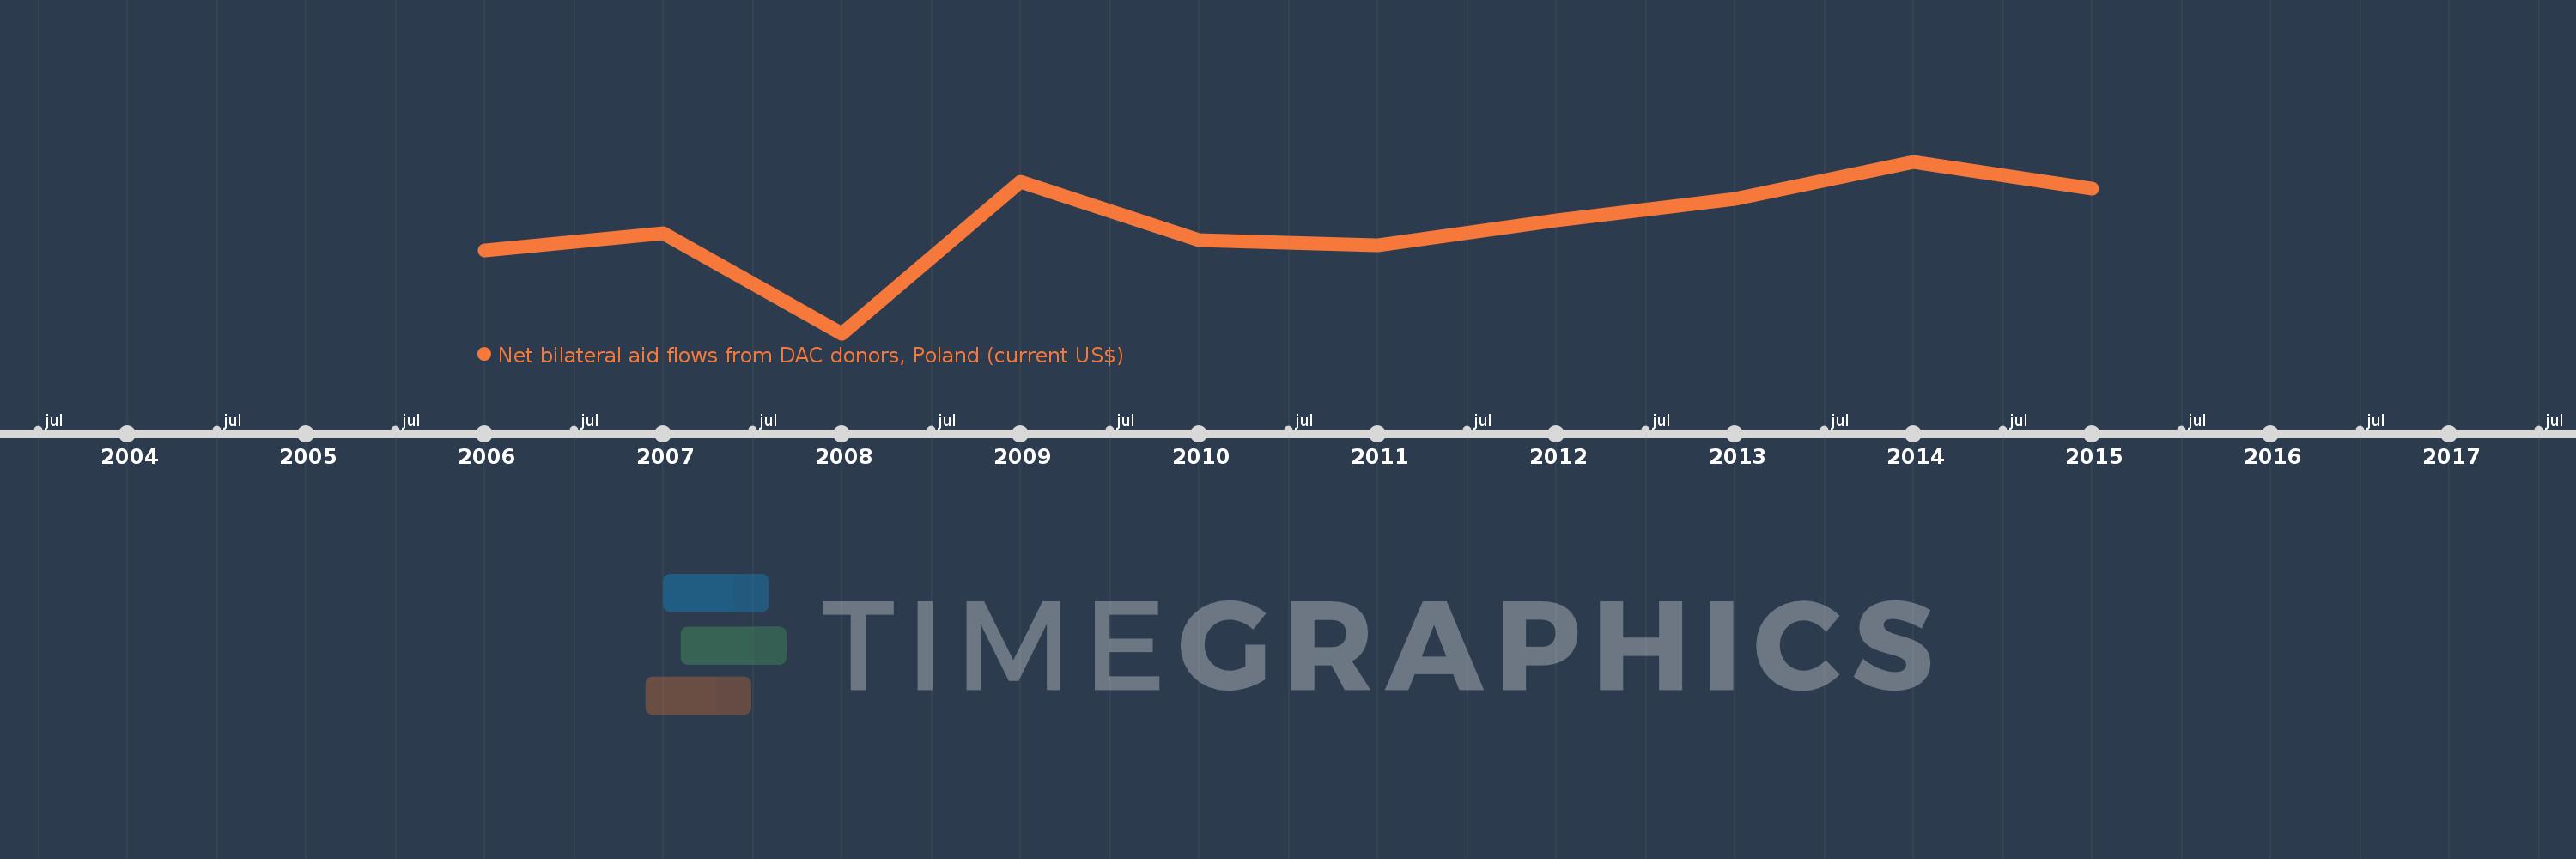
Net bilateral aid flows from DAC donors, Poland (current US$)
2015,2014,2013,2012,2011,2010,2009,2008,2007,2006
This statistics in other country:
Timeline:
This timeline shows a graph from 2006 to 2015 of Arab World. No data until 2005. Number of actual observations by date: 10.
Source name:
World Development Indicators
Source organization:
Development Assistance Committee of the Organisation for Economic Co-operation and Development, Geographical Distribution of Financial Flows to Developing Countries, Development Co-operation Report, and International Development Statistics database. Data are available online at: www.oecd.org/dac/stats/idsonline.
Categories, topics:
Aid Effectiveness
Last updated:
apr 23, 2017
Indicators value changes by year
Minimum:
-1.86 mln
jan 1, 2008
Maximum:
4.04 mln
jan 1, 2014
At the date of observation
Value
Absolute change
Change from previous value
jan 1, 2006
990.0K
+990.0K
0.0%
jan 1, 2007
1.57 mln
+580.0K
58.59%
jan 1, 2008
-1.86 mln
-3.43 mln
-218.47%
jan 1, 2009
3.36 mln
+5.22 mln
-280.65%
jan 1, 2010
1.35 mln
-2.01 mln
-59.82%
jan 1, 2011
1.15 mln
-200.0K
-14.81%
jan 1, 2012
2.01 mln
+860.0K
74.78%
jan 1, 2013
2.75 mln
+740.0K
36.82%
jan 1, 2014
4.04 mln
+1.29 mln
46.91%
jan 1, 2015
3.12 mln
-920.0K
-22.77%
Ranking of countries by current statistics by years


Comments: