29
/
en
AIzaSyAYiBZKx7MnpbEhh9jyipgxe19OcubqV5w
April 1, 2024
50272
Middle East & North Africa (IDA & IBRD countries)
TMN
false
2
1
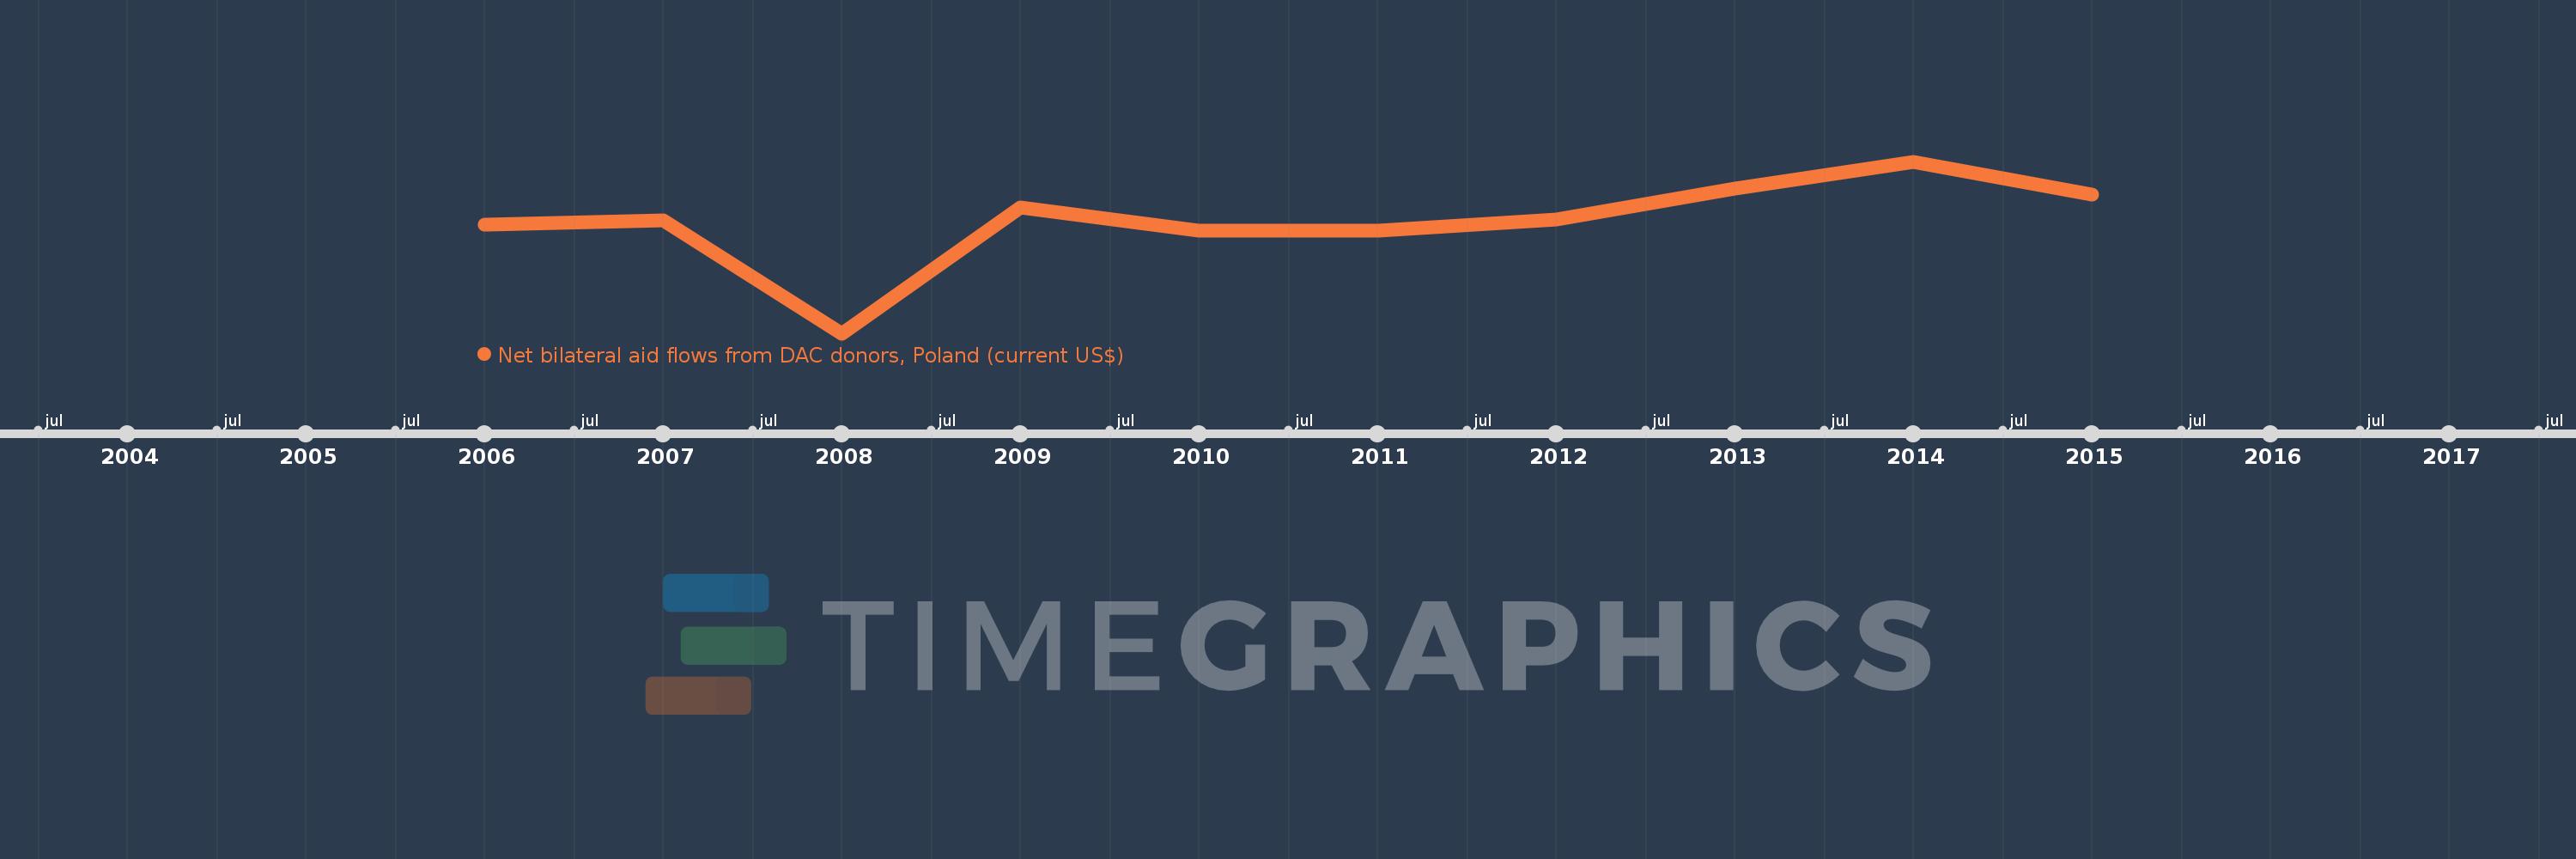
Net bilateral aid flows from DAC donors, Poland (current US$)
2015,2014,2013,2012,2011,2010,2009,2008,2007,2006
This statistics in other country:
Timeline:
This timeline shows a graph from 2006 to 2015 of Middle East & North Africa (IDA & IBRD countries). No data until 2005. Number of actual observations by date: 10.
Source name:
World Development Indicators
Source organization:
Development Assistance Committee of the Organisation for Economic Co-operation and Development, Geographical Distribution of Financial Flows to Developing Countries, Development Co-operation Report, and International Development Statistics database. Data are available online at: www.oecd.org/dac/stats/idsonline.
Categories, topics:
Aid Effectiveness
Last updated:
apr 23, 2017
Indicators value changes by year
Minimum:
-3.41 mln
jan 1, 2008
Maximum:
3.29 mln
jan 1, 2014
At the date of observation
Value
Absolute change
Change from previous value
jan 1, 2006
840.0K
+840.0K
0.0%
jan 1, 2007
1.01 mln
+170.0K
20.24%
jan 1, 2008
-3.41 mln
-4.42 mln
-437.62%
jan 1, 2009
1.5 mln
+4.91 mln
-143.99%
jan 1, 2010
590.0K
-910.0K
-60.67%
jan 1, 2011
590.0K
0.0
0.0%
jan 1, 2012
1.02 mln
+430.0K
72.88%
jan 1, 2013
2.24 mln
+1.22 mln
119.61%
jan 1, 2014
3.29 mln
+1.05 mln
46.88%
jan 1, 2015
2.0 mln
-1.29 mln
-39.21%
Ranking of countries by current statistics by years


Comments: