29
/
en
AIzaSyAYiBZKx7MnpbEhh9jyipgxe19OcubqV5w
April 1, 2024
44490
Least developed countries: UN classification
LDC
false
2
1
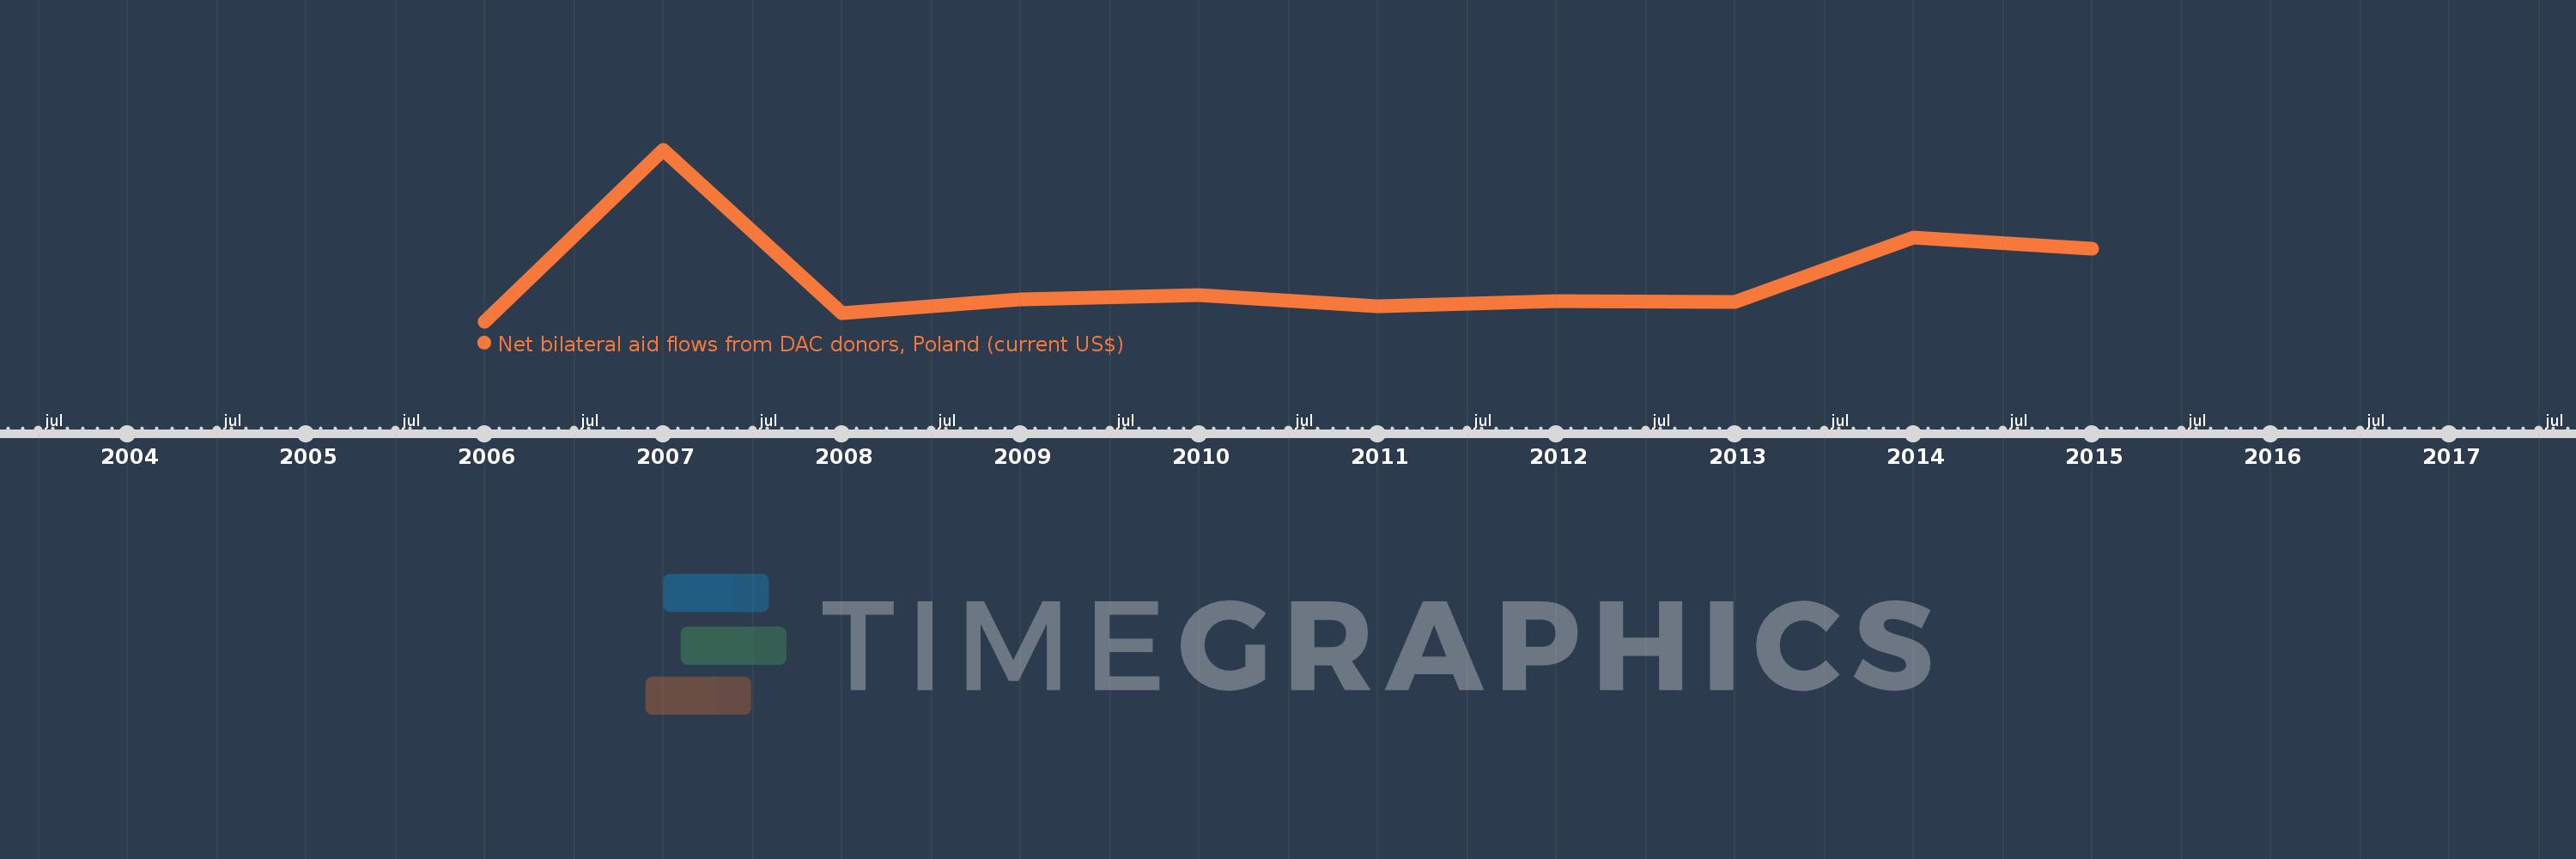
Net bilateral aid flows from DAC donors, Poland (current US$)
2015,2014,2013,2012,2011,2010,2009,2008,2007,2006
This statistics in other country:
Timeline:
This timeline shows a graph from 2006 to 2015 of Least developed countries: UN classification. No data until 2005. Number of actual observations by date: 10.
Source name:
World Development Indicators
Source organization:
Development Assistance Committee of the Organisation for Economic Co-operation and Development, Geographical Distribution of Financial Flows to Developing Countries, Development Co-operation Report, and International Development Statistics database. Data are available online at: www.oecd.org/dac/stats/idsonline.
Categories, topics:
Aid Effectiveness
Last updated:
apr 23, 2017
Indicators value changes by year
Minimum:
930.0K
jan 1, 2006
Maximum:
93.89 mln
jan 1, 2007
At the date of observation
Value
Absolute change
Change from previous value
jan 1, 2006
930.0K
+930.0K
0.0%
jan 1, 2007
93.89 mln
+92.96 mln
10.0K%
jan 1, 2008
5.79 mln
-88.1 mln
-93.83%
jan 1, 2009
13.17 mln
+7.38 mln
127.46%
jan 1, 2010
15.66 mln
+2.49 mln
18.91%
jan 1, 2011
9.37 mln
-6.29 mln
-40.17%
jan 1, 2012
12.17 mln
+2.8 mln
29.88%
jan 1, 2013
11.69 mln
-480.0K
-3.94%
jan 1, 2014
46.6 mln
+34.91 mln
298.63%
jan 1, 2015
40.73 mln
-5.87 mln
-12.6%
Ranking of countries by current statistics by years


Comments: