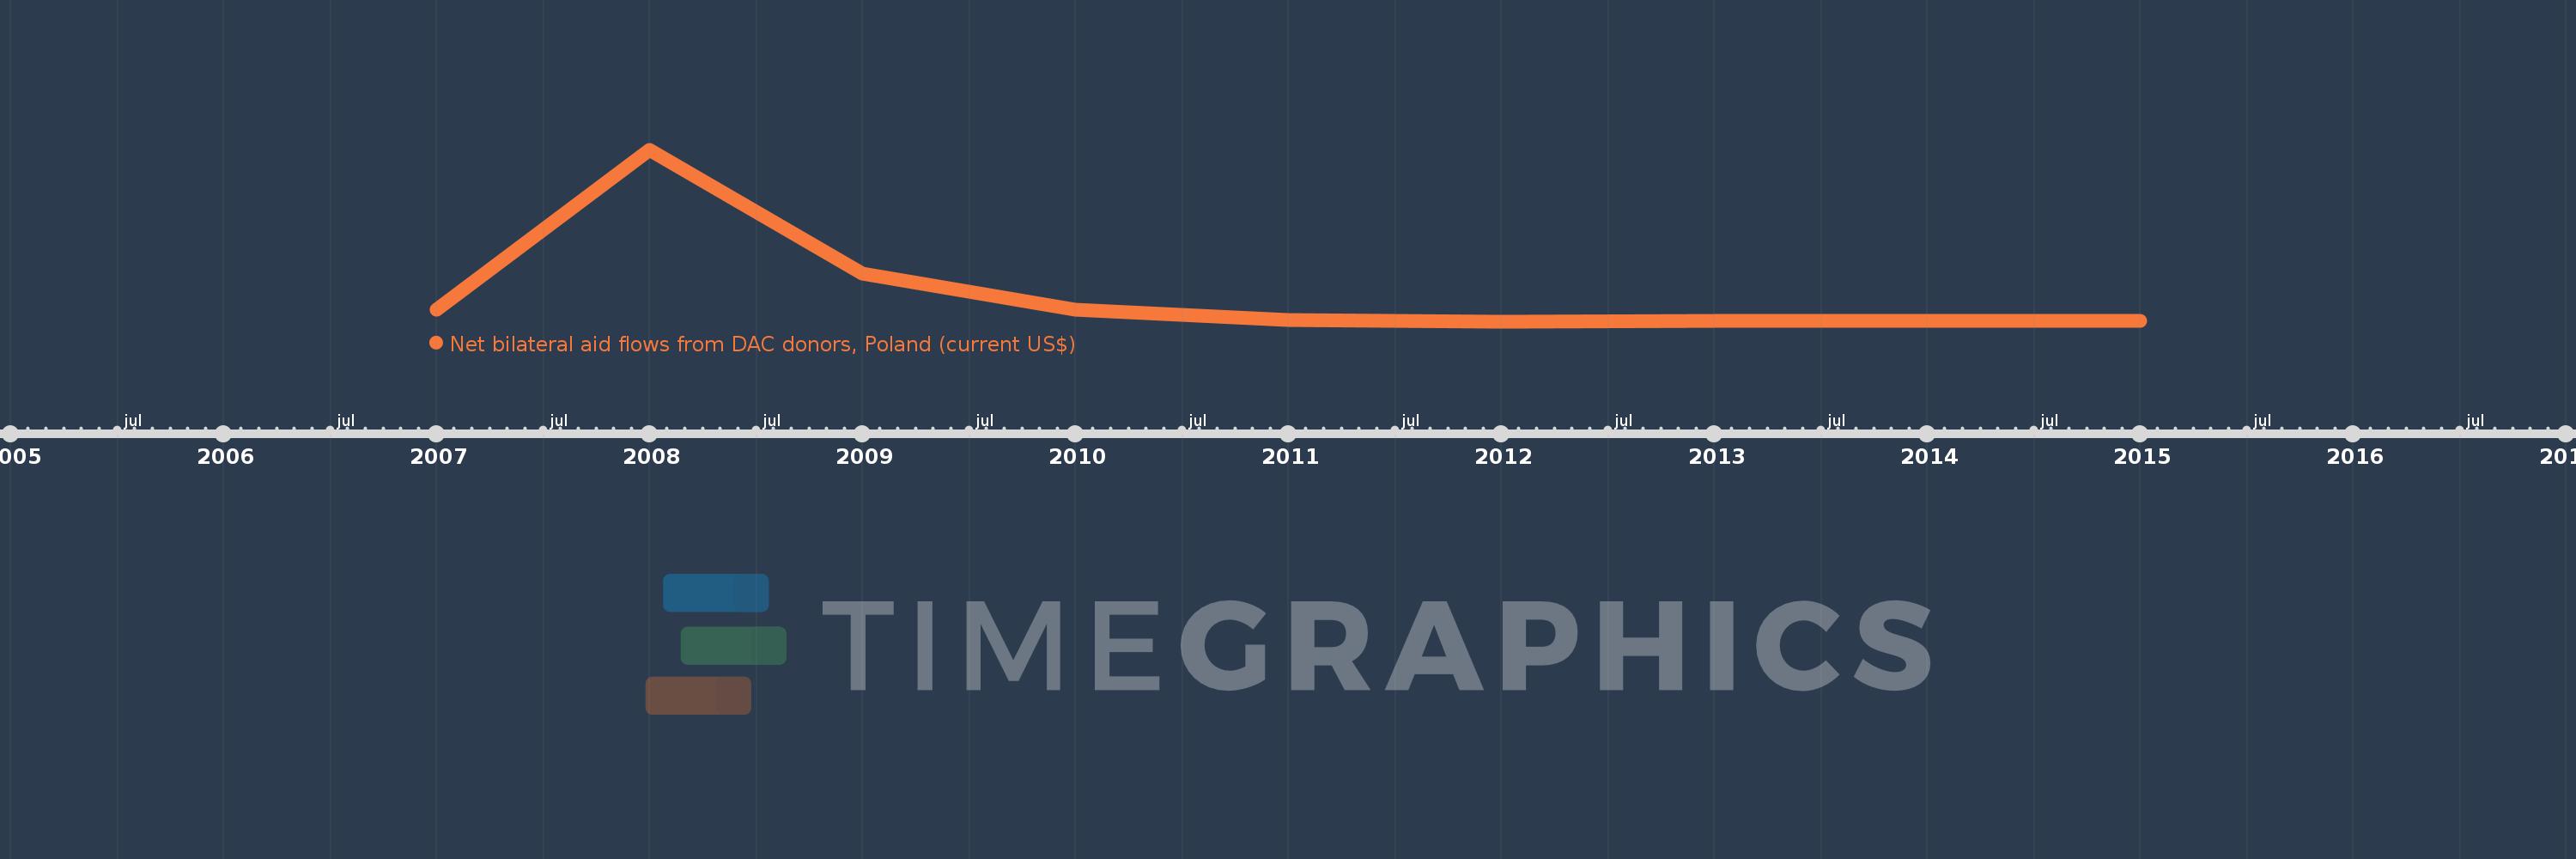
This timeline shows a graph from 2007 to 2015 of Small states. No data until 2006. Number of actual observations by date: 9.
Source name:
World Development Indicators
Source organization:
Development Assistance Committee of the Organisation for Economic Co-operation and Development, Geographical Distribution of Financial Flows to Developing Countries, Development Co-operation Report, and International Development Statistics database. Data are available online at: www.oecd.org/dac/stats/idsonline.
Categories, topics:
Aid Effectiveness
Last updated:
apr 23, 2017
Indicators value changes by year
Meaning:
1.387 mln
Minimum:
-910.0K
jan 1, 2012
Maximum:
13.34 mln
jan 1, 2008
At the date of observation
Value
Absolute change
Change from the previous value
jan 1, 2007
120.0K
+120.0K
0.0%
jan 1, 2008
13.34 mln
+13.22 mln
11.02K%
jan 1, 2009
3.13 mln
-10.21 mln
-76.54%
jan 1, 2010
80.0K
-3.05 mln
-97.44%
jan 1, 2011
-780.0K
-860.0K
-1.07K%
jan 1, 2012
-910.0K
-130.0K
16.67%
jan 1, 2013
-850.0K
+60.0K
-6.59%
jan 1, 2014
-830.0K
+20.0K
-2.35%
jan 1, 2015
-820.0K
+10.0K
-1.2%
Ranking of countries by current statistics by years
