29
/
en
AIzaSyAYiBZKx7MnpbEhh9jyipgxe19OcubqV5w
April 1, 2024
61347
Upper middle income
UMC
false
2
1
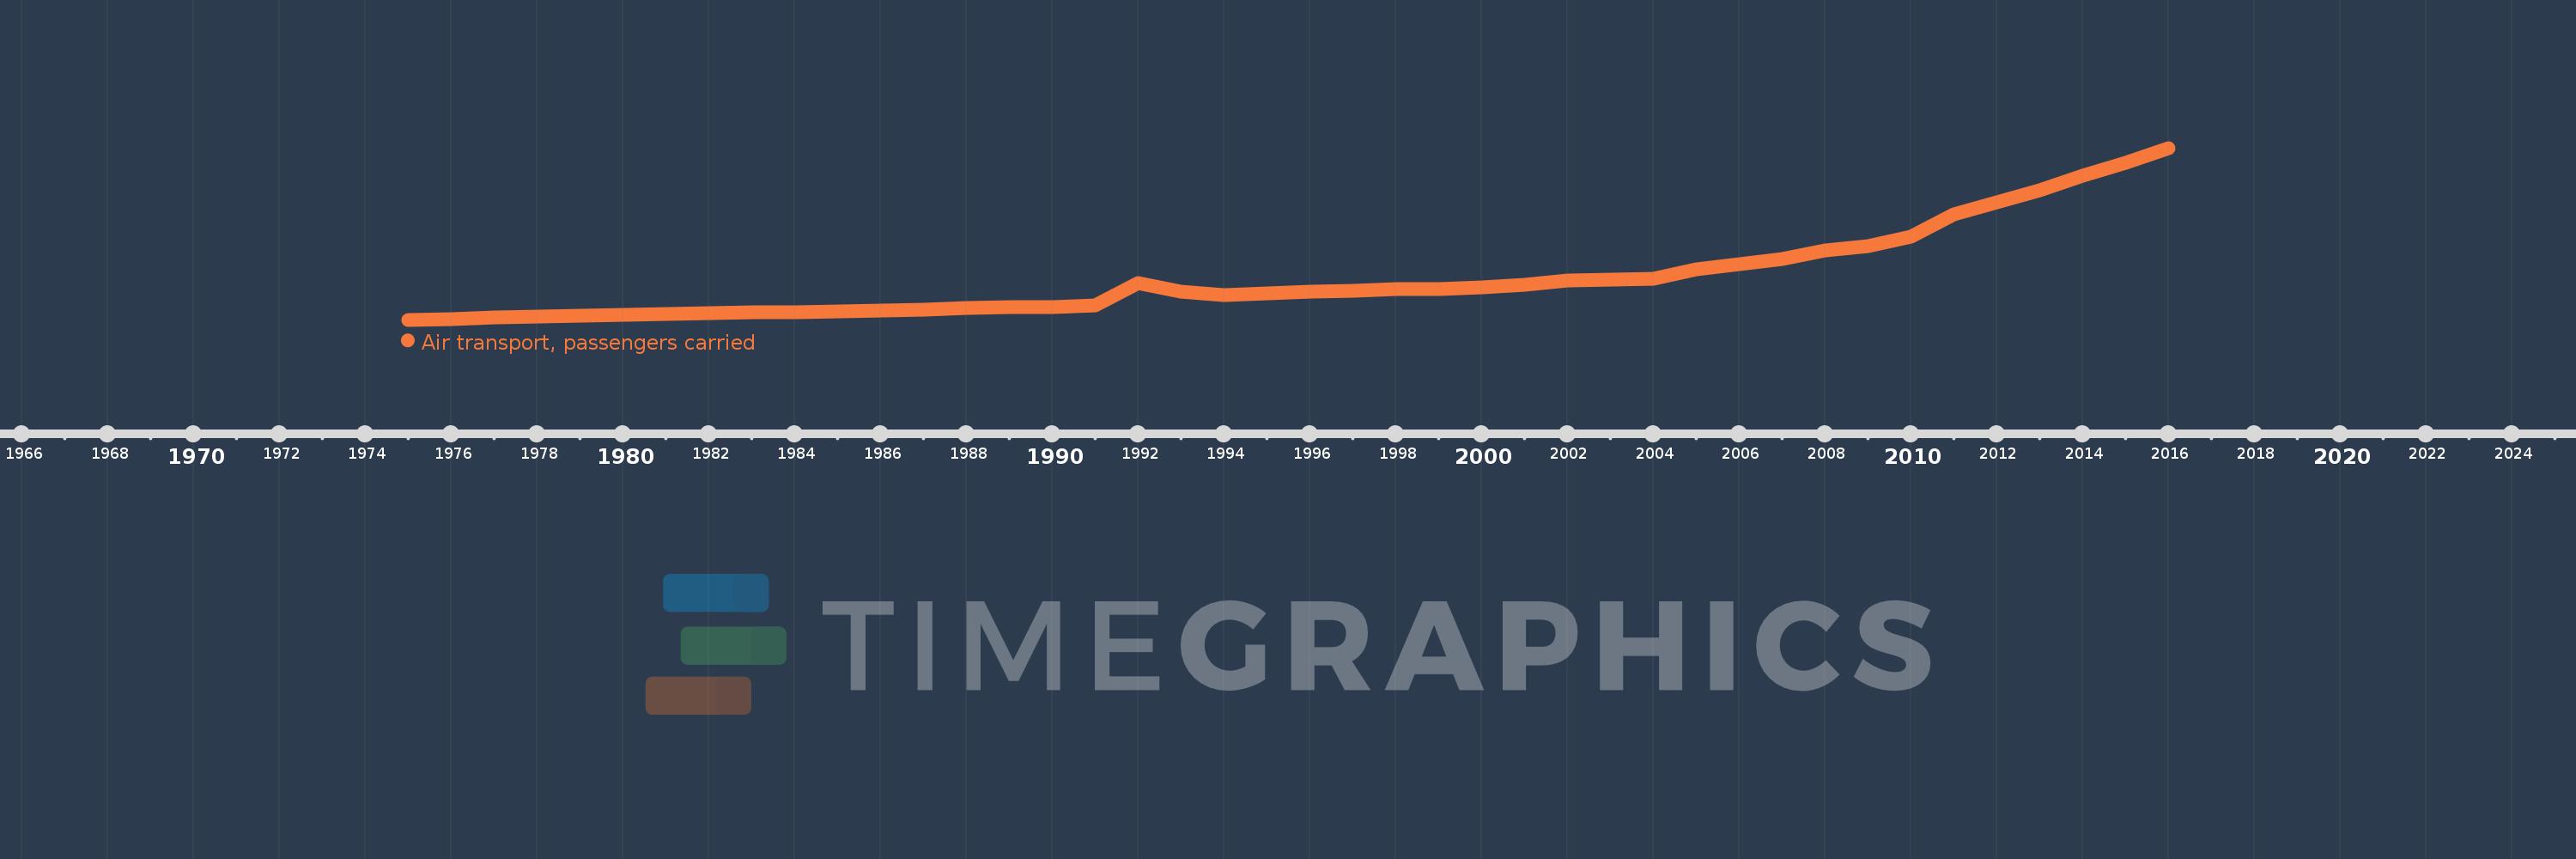
Air transport, passengers carried
2016,2015,2014,2013,2012,2011,2010,2009,2008,2007,2006,2005,2004,2003,2002,2001,2000,1999,1998,1997,1996,1995,1994,1993,1992,1991,1990,1989,1988,1987,1986,1985,1984,1983,1982,1981,1980,1979,1978,1977,1976,1975
This statistics in other country:
AfghanistanAlbaniaAlgeriaAmerican SamoaAngolaAntigua and BarbudaArab WorldArgentinaArmeniaAustraliaAustriaAzerbaijanBahamas, TheBahrainBangladeshBarbadosBelarusBelgiumBelizeBeninBhutanBoliviaBosnia and HerzegovinaBotswanaBrazilBrunei DarussalamBulgariaBurkina FasoBurundiCabo VerdeCambodiaCameroonCanadaCaribbean small statesCentral African RepublicCentral Europe and the BalticsChadChileChinaColombiaComorosCongo, Dem. Rep.Congo, Rep.Costa RicaCote d'IvoireCroatiaCubaCyprusCzech RepublicDenmarkDjiboutiDominican RepublicEarly-demographic dividendEast Asia & PacificEast Asia & Pacific (excluding high income)East Asia & Pacific (IDA & IBRD countries)EcuadorEgypt, Arab Rep.El SalvadorEquatorial GuineaEritreaEstoniaEthiopiaEuro areaEurope & Central AsiaEurope & Central Asia (excluding high income)Europe & Central Asia (IDA & IBRD countries)European UnionFijiFinlandFragile and conflict affected situationsFranceGabonGambia, TheGeorgiaGermanyGhanaGreeceGuamGuatemalaGuineaGuinea-BissauGuyanaHaitiHeavily indebted poor countries (HIPC)High incomeHondurasHong Kong SAR, ChinaHungaryIBRD onlyIcelandIDA & IBRD totalIDA blendIDA onlyIDA totalIndiaIndonesiaIran, Islamic Rep.IraqIrelandIsraelItalyJamaicaJapanJordanKazakhstanKenyaKiribatiKorea, Dem. People’s Rep.Korea, Rep.KuwaitKyrgyz RepublicLao PDRLate-demographic dividendLatin America & Caribbean Latin America & Caribbean (excluding high income)Latin America & the Caribbean (IDA & IBRD countries)LatviaLeast developed countries: UN classificationLebanonLesothoLiberiaLibyaLithuaniaLow & middle incomeLow incomeLower middle incomeLuxembourgMacao SAR, ChinaMacedonia, FYRMadagascarMalawiMalaysiaMaldivesMaliMaltaMarshall IslandsMauritaniaMauritiusMexicoMiddle East & North AfricaMiddle East & North Africa (excluding high income)Middle East & North Africa (IDA & IBRD countries)Middle incomeMoldovaMonacoMongoliaMontenegroMoroccoMozambiqueMyanmarNamibiaNauruNepalNetherlandsNew ZealandNicaraguaNigerNigeriaNorth AmericaNorwayOECD membersOmanOther small statesPacific island small statesPakistanPanamaPapua New GuineaParaguayPeruPhilippinesPolandPortugalPost-demographic dividendPre-demographic dividendQatarRomaniaRussian FederationRwandaSamoaSao Tome and PrincipeSaudi ArabiaSenegalSerbiaSeychellesSierra LeoneSingaporeSlovak RepublicSloveniaSmall statesSolomon IslandsSomaliaSouth AfricaSouth AsiaSouth Asia (IDA & IBRD)SpainSri LankaSub-Saharan Africa Sub-Saharan Africa (excluding high income)Sub-Saharan Africa (IDA & IBRD countries)SudanSurinameSwazilandSwedenSwitzerlandSyrian Arab RepublicTajikistanTanzaniaThailandTogoTongaTrinidad and TobagoTunisiaTurkeyTurkmenistanUgandaUkraineUnited Arab EmiratesUnited KingdomUnited StatesUpper middle incomeUruguayUzbekistanVanuatuVenezuela, RBVietnamWorldYemen, Rep.ZambiaZimbabwe Timeline:
This timeline shows a graph from 1975 to 2016 of Upper middle income. No data until 1974. Number of actual observations by date: 42.
Source name:
World Development Indicators
Source organization:
International Civil Aviation Organization, Civil Aviation Statistics of the World and ICAO staff estimates.
Categories, topics:
Infrastructure
Last updated:
apr 23, 2017
Indicators value changes by year
Minimum:
39.935 mln
jan 1, 1975
Maximum:
1.02 bln
jan 1, 2016
At the date of observation
Value
Absolute change
Change from previous value
jan 1, 1975
39.935 mln
+39.935 mln
0.0%
jan 1, 1976
45.514 mln
+5.58 mln
13.97%
jan 1, 1977
51.519 mln
+6.005 mln
13.19%
jan 1, 1978
56.122 mln
+4.603 mln
8.93%
jan 1, 1979
61.586 mln
+5.464 mln
9.74%
jan 1, 1980
70.142 mln
+8.556 mln
13.89%
jan 1, 1981
75.104 mln
+4.962 mln
7.07%
jan 1, 1982
77.378 mln
+2.273 mln
3.03%
jan 1, 1983
80.278 mln
+2.9 mln
3.75%
jan 1, 1984
82.408 mln
+2.131 mln
2.65%
jan 1, 1985
86.318 mln
+3.909 mln
4.74%
jan 1, 1986
90.561 mln
+4.243 mln
4.92%
jan 1, 1987
98.282 mln
+7.721 mln
8.53%
jan 1, 1988
105.284 mln
+7.002 mln
7.12%
jan 1, 1989
112.171 mln
+6.887 mln
6.54%
jan 1, 1990
113.841 mln
+1.67 mln
1.49%
jan 1, 1991
121.081 mln
+7.24 mln
6.36%
jan 1, 1992
248.832 mln
+127.751 mln
105.51%
jan 1, 1993
199.537 mln
-49.295 mln
-19.81%
jan 1, 1994
180.354 mln
-19.183 mln
-9.61%
jan 1, 1995
188.913 mln
+8.559 mln
4.75%
jan 1, 1996
200.199 mln
+11.286 mln
5.97%
jan 1, 1997
206.849 mln
+6.65 mln
3.32%
jan 1, 1998
215.427 mln
+8.578 mln
4.15%
jan 1, 1999
213.275 mln
-2.152 mln
-1.0%
jan 1, 2000
224.327 mln
+11.052 mln
5.18%
jan 1, 2001
238.638 mln
+14.311 mln
6.38%
jan 1, 2002
264.277 mln
+25.639 mln
10.74%
jan 1, 2003
266.896 mln
+2.619 mln
0.99%
jan 1, 2004
275.609 mln
+8.712 mln
3.26%
jan 1, 2005
326.796 mln
+51.187 mln
18.57%
jan 1, 2006
355.577 mln
+28.781 mln
8.81%
jan 1, 2007
387.567 mln
+31.989 mln
9.0%
jan 1, 2008
435.911 mln
+48.344 mln
12.47%
jan 1, 2009
461.904 mln
+25.993 mln
5.96%
jan 1, 2010
512.01 mln
+50.106 mln
10.85%
jan 1, 2011
642.307 mln
+130.297 mln
25.45%
jan 1, 2012
709.114 mln
+66.806 mln
10.4%
jan 1, 2013
776.424 mln
+67.31 mln
9.49%
jan 1, 2014
860.679 mln
+84.255 mln
10.85%
jan 1, 2015
934.954 mln
+74.274 mln
8.63%
jan 1, 2016
1.02 bln
+85.381 mln
9.13%
Ranking of countries by current statistics by years


Comments: