29
/
en
AIzaSyAYiBZKx7MnpbEhh9jyipgxe19OcubqV5w
April 1, 2024
276378
United States
USA
true
2
1
Air transport, passengers carried
2016,2015,2014,2013,2012,2011,2010,2009,2008,2007,2006,2005,2004,2003,2002,2001,2000,1999,1998,1997,1996,1995,1994,1993,1992,1991,1990,1989,1988,1987,1986,1985,1984,1983,1982,1981,1980,1979,1978,1977,1976,1975,1974,1973,1972,1971
This statistics in other country:
AfghanistanAlbaniaAlgeriaAmerican SamoaAngolaAntigua and BarbudaArab WorldArgentinaArmeniaAustraliaAustriaAzerbaijanBahamas, TheBahrainBangladeshBarbadosBelarusBelgiumBelizeBeninBhutanBoliviaBosnia and HerzegovinaBotswanaBrazilBrunei DarussalamBulgariaBurkina FasoBurundiCabo VerdeCambodiaCameroonCanadaCaribbean small statesCentral African RepublicCentral Europe and the BalticsChadChileChinaColombiaComorosCongo, Dem. Rep.Congo, Rep.Costa RicaCote d'IvoireCroatiaCubaCyprusCzech RepublicDenmarkDjiboutiDominican RepublicEarly-demographic dividendEast Asia & PacificEast Asia & Pacific (excluding high income)East Asia & Pacific (IDA & IBRD countries)EcuadorEgypt, Arab Rep.El SalvadorEquatorial GuineaEritreaEstoniaEthiopiaEuro areaEurope & Central AsiaEurope & Central Asia (excluding high income)Europe & Central Asia (IDA & IBRD countries)European UnionFijiFinlandFragile and conflict affected situationsFranceGabonGambia, TheGeorgiaGermanyGhanaGreeceGuamGuatemalaGuineaGuinea-BissauGuyanaHaitiHeavily indebted poor countries (HIPC)High incomeHondurasHong Kong SAR, ChinaHungaryIBRD onlyIcelandIDA & IBRD totalIDA blendIDA onlyIDA totalIndiaIndonesiaIran, Islamic Rep.IraqIrelandIsraelItalyJamaicaJapanJordanKazakhstanKenyaKiribatiKorea, Dem. People’s Rep.Korea, Rep.KuwaitKyrgyz RepublicLao PDRLate-demographic dividendLatin America & Caribbean Latin America & Caribbean (excluding high income)Latin America & the Caribbean (IDA & IBRD countries)LatviaLeast developed countries: UN classificationLebanonLesothoLiberiaLibyaLithuaniaLow & middle incomeLow incomeLower middle incomeLuxembourgMacao SAR, ChinaMacedonia, FYRMadagascarMalawiMalaysiaMaldivesMaliMaltaMarshall IslandsMauritaniaMauritiusMexicoMiddle East & North AfricaMiddle East & North Africa (excluding high income)Middle East & North Africa (IDA & IBRD countries)Middle incomeMoldovaMonacoMongoliaMontenegroMoroccoMozambiqueMyanmarNamibiaNauruNepalNetherlandsNew ZealandNicaraguaNigerNigeriaNorth AmericaNorwayOECD membersOmanOther small statesPacific island small statesPakistanPanamaPapua New GuineaParaguayPeruPhilippinesPolandPortugalPost-demographic dividendPre-demographic dividendQatarRomaniaRussian FederationRwandaSamoaSao Tome and PrincipeSaudi ArabiaSenegalSerbiaSeychellesSierra LeoneSingaporeSlovak RepublicSloveniaSmall statesSolomon IslandsSomaliaSouth AfricaSouth AsiaSouth Asia (IDA & IBRD)SpainSri LankaSub-Saharan Africa Sub-Saharan Africa (excluding high income)Sub-Saharan Africa (IDA & IBRD countries)SudanSurinameSwazilandSwedenSwitzerlandSyrian Arab RepublicTajikistanTanzaniaThailandTogoTongaTrinidad and TobagoTunisiaTurkeyTurkmenistanUgandaUkraineUnited Arab EmiratesUnited KingdomUnited StatesUpper middle incomeUruguayUzbekistanVanuatuVenezuela, RBVietnamWorldYemen, Rep.ZambiaZimbabwe Timeline:
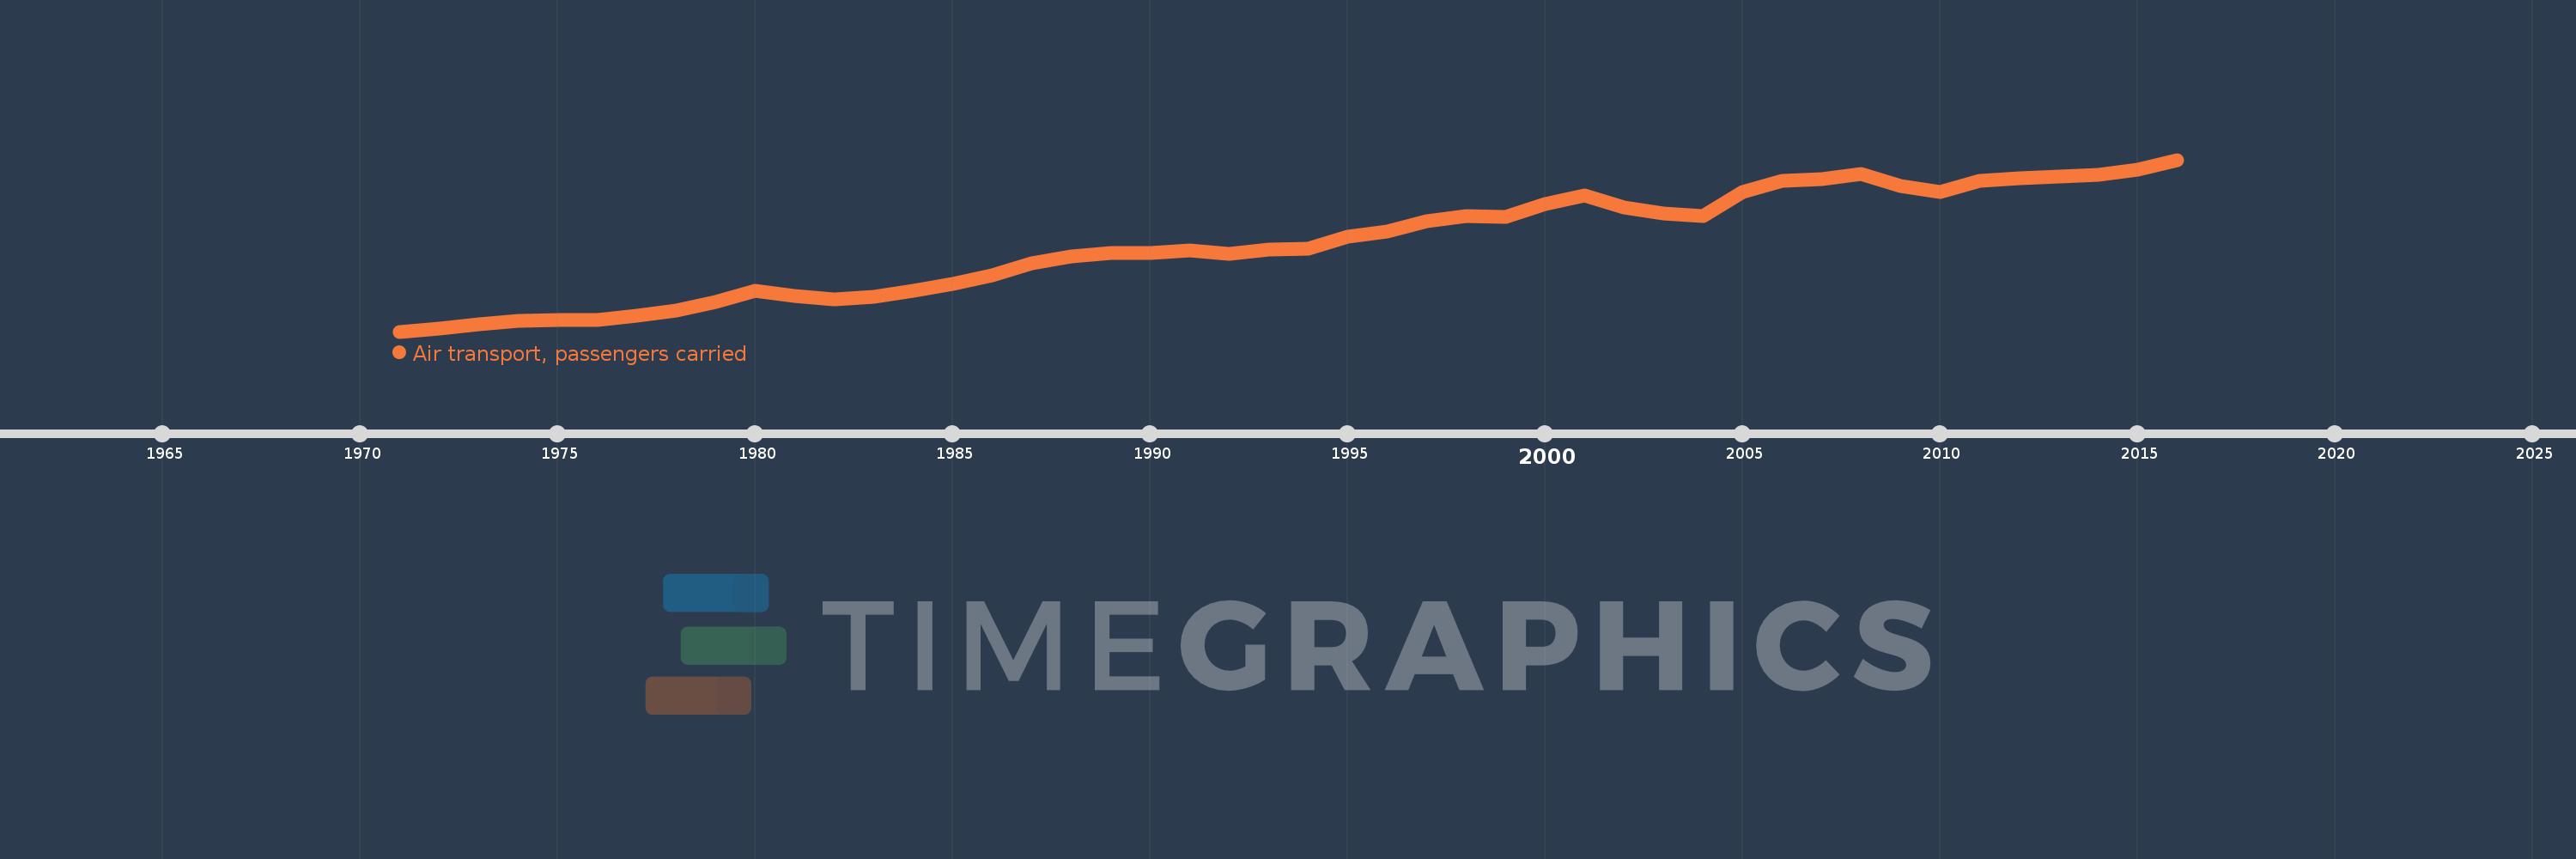
This timeline shows a graph from 1971 to 2016 of United States. No data until 1970. Number of actual observations by date: 46.
Source name:
World Development Indicators
Source organization:
International Civil Aviation Organization, Civil Aviation Statistics of the World and ICAO staff estimates.
Categories, topics:
Infrastructure
Last updated:
apr 23, 2017
Indicators value changes by year
Minimum:
163.449 mln
jan 1, 1971
Maximum:
798.23 mln
jan 1, 2016
At the date of observation
Value
Absolute change
Change from previous value
jan 1, 1971
163.449 mln
+163.449 mln
0.0%
jan 1, 1972
174.143 mln
+10.694 mln
6.54%
jan 1, 1973
191.325 mln
+17.182 mln
9.87%
jan 1, 1974
202.309 mln
+10.984 mln
5.74%
jan 1, 1975
207.612 mln
+5.303 mln
2.62%
jan 1, 1976
204.9 mln
-2.712 mln
-1.31%
jan 1, 1977
223.017 mln
+18.117 mln
8.84%
jan 1, 1978
240.145 mln
+17.128 mln
7.68%
jan 1, 1979
273.026 mln
+32.881 mln
13.69%
jan 1, 1980
313.624 mln
+40.598 mln
14.87%
jan 1, 1981
295.329 mln
-18.295 mln
-5.83%
jan 1, 1982
281.086 mln
-14.243 mln
-4.82%
jan 1, 1983
290.993 mln
+9.906 mln
3.52%
jan 1, 1984
315.6 mln
+24.607 mln
8.46%
jan 1, 1985
340.191 mln
+24.591 mln
7.79%
jan 1, 1986
372.059 mln
+31.868 mln
9.37%
jan 1, 1987
414.554 mln
+42.495 mln
11.42%
jan 1, 1988
441.833 mln
+27.278 mln
6.58%
jan 1, 1989
454.203 mln
+12.37 mln
2.8%
jan 1, 1990
453.162 mln
-1.041 mln
-0.23%
jan 1, 1991
464.574 mln
+11.413 mln
2.52%
jan 1, 1992
452.016 mln
-12.558 mln
-2.7%
jan 1, 1993
466.965 mln
+14.949 mln
3.31%
jan 1, 1994
469.926 mln
+2.961 mln
0.63%
jan 1, 1995
514.924 mln
+44.998 mln
9.58%
jan 1, 1996
533.512 mln
+18.588 mln
3.61%
jan 1, 1997
571.072 mln
+37.56 mln
7.04%
jan 1, 1998
590.571 mln
+19.499 mln
3.41%
jan 1, 1999
588.171 mln
-2.401 mln
-0.41%
jan 1, 2000
634.365 mln
+46.194 mln
7.85%
jan 1, 2001
665.327 mln
+30.963 mln
4.88%
jan 1, 2002
622.188 mln
-43.14 mln
-6.48%
jan 1, 2003
598.41 mln
-23.777 mln
-3.82%
jan 1, 2004
588.997 mln
-9.413 mln
-1.57%
jan 1, 2005
678.111 mln
+89.113 mln
15.13%
jan 1, 2006
720.548 mln
+42.437 mln
6.26%
jan 1, 2007
725.531 mln
+4.983 mln
0.69%
jan 1, 2008
744.302 mln
+18.771 mln
2.59%
jan 1, 2009
701.78 mln
-42.523 mln
-5.71%
jan 1, 2010
679.423 mln
-22.356 mln
-3.19%
jan 1, 2011
720.497 mln
+41.074 mln
6.05%
jan 1, 2012
730.796 mln
+10.299 mln
1.43%
jan 1, 2013
736.699 mln
+5.903 mln
0.81%
jan 1, 2014
743.171 mln
+6.472 mln
0.88%
jan 1, 2015
762.71 mln
+19.539 mln
2.63%
jan 1, 2016
798.23 mln
+35.52 mln
4.66%
Ranking of countries by current statistics by years


Comments: