29
/
en
AIzaSyAYiBZKx7MnpbEhh9jyipgxe19OcubqV5w
April 1, 2024
203845
Myanmar
MMR
true
2
1
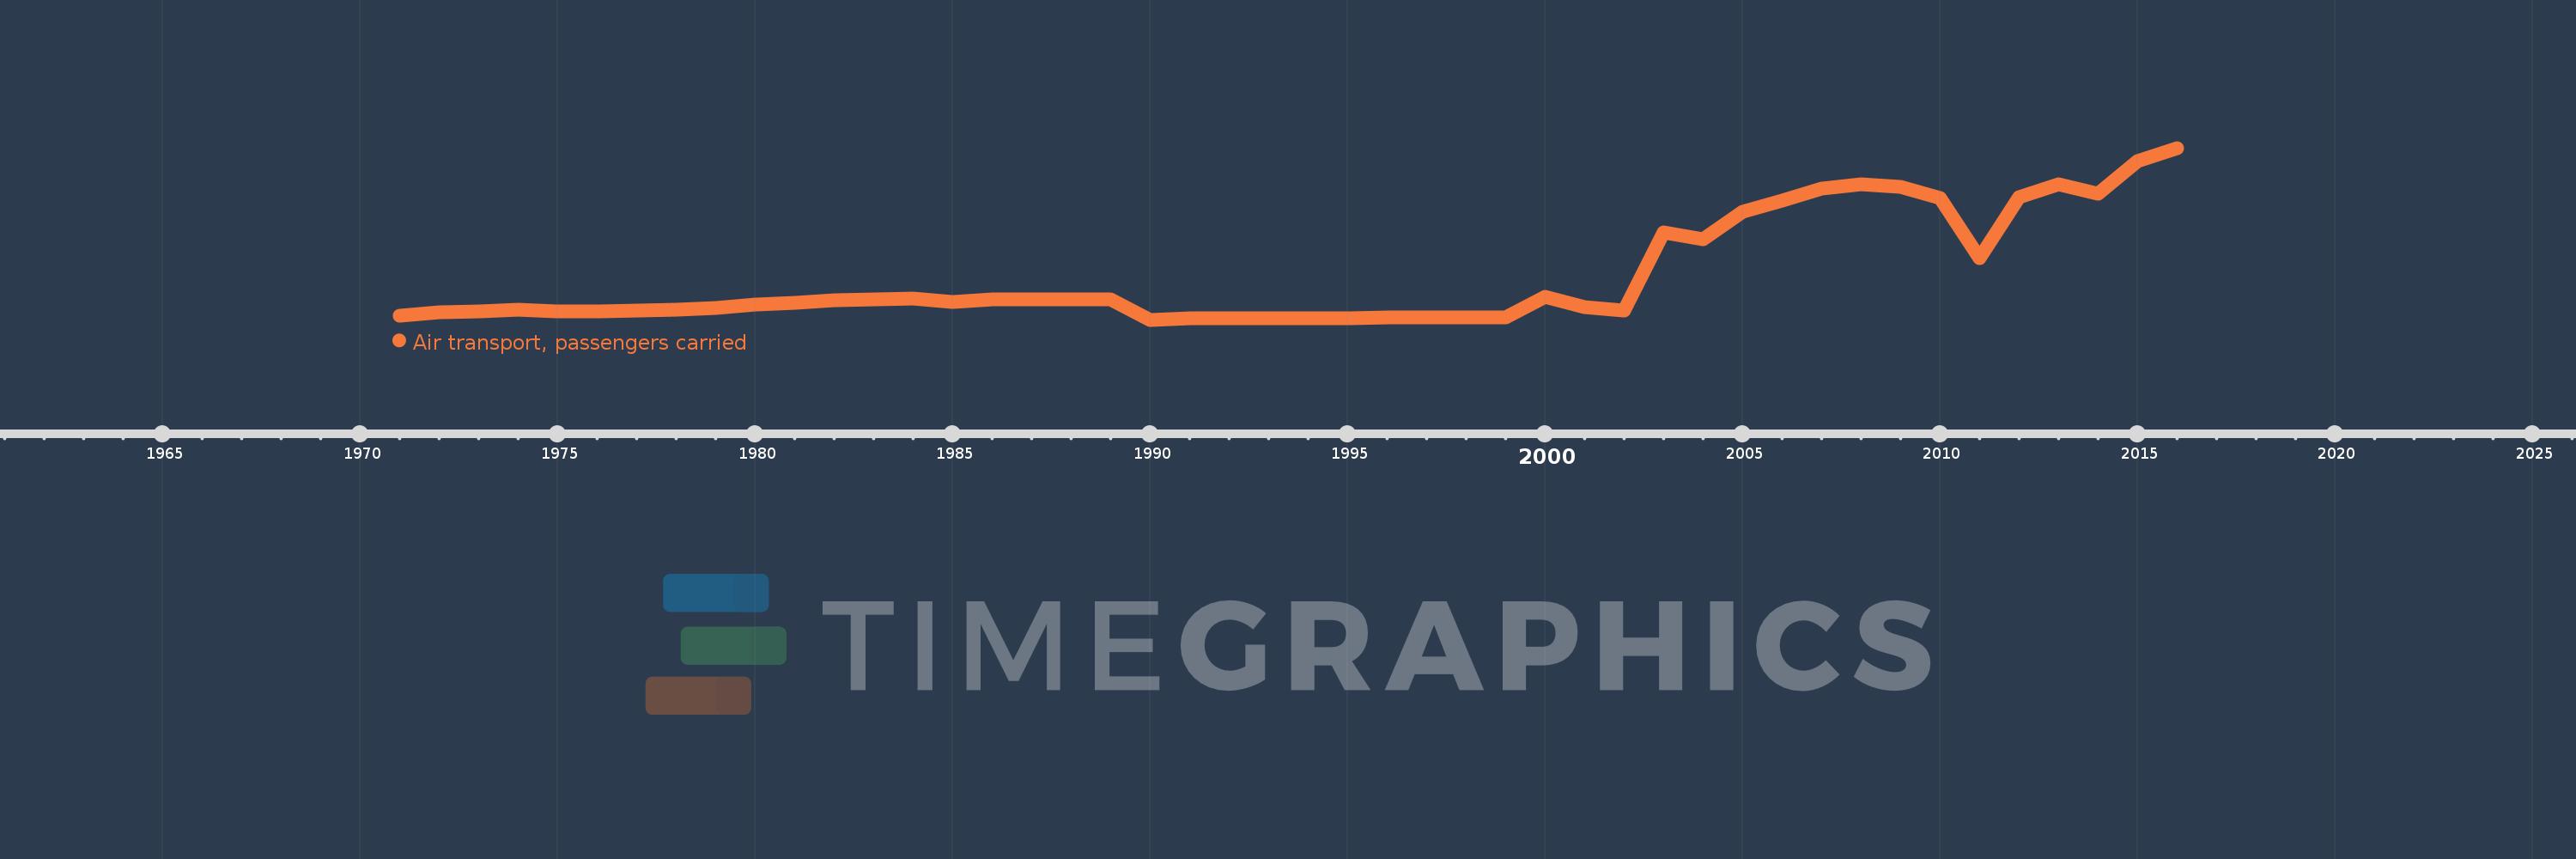
Air transport, passengers carried
2016,2015,2014,2013,2012,2011,2010,2009,2008,2007,2006,2005,2004,2003,2002,2001,2000,1999,1998,1997,1996,1995,1994,1993,1992,1991,1990,1989,1988,1987,1986,1985,1984,1983,1982,1981,1980,1979,1978,1977,1976,1975,1974,1973,1972,1971
This statistics in other country:
AfghanistanAlbaniaAlgeriaAmerican SamoaAngolaAntigua and BarbudaArab WorldArgentinaArmeniaAustraliaAustriaAzerbaijanBahamas, TheBahrainBangladeshBarbadosBelarusBelgiumBelizeBeninBhutanBoliviaBosnia and HerzegovinaBotswanaBrazilBrunei DarussalamBulgariaBurkina FasoBurundiCabo VerdeCambodiaCameroonCanadaCaribbean small statesCentral African RepublicCentral Europe and the BalticsChadChileChinaColombiaComorosCongo, Dem. Rep.Congo, Rep.Costa RicaCote d'IvoireCroatiaCubaCyprusCzech RepublicDenmarkDjiboutiDominican RepublicEarly-demographic dividendEast Asia & PacificEast Asia & Pacific (excluding high income)East Asia & Pacific (IDA & IBRD countries)EcuadorEgypt, Arab Rep.El SalvadorEquatorial GuineaEritreaEstoniaEthiopiaEuro areaEurope & Central AsiaEurope & Central Asia (excluding high income)Europe & Central Asia (IDA & IBRD countries)European UnionFijiFinlandFragile and conflict affected situationsFranceGabonGambia, TheGeorgiaGermanyGhanaGreeceGuamGuatemalaGuineaGuinea-BissauGuyanaHaitiHeavily indebted poor countries (HIPC)High incomeHondurasHong Kong SAR, ChinaHungaryIBRD onlyIcelandIDA & IBRD totalIDA blendIDA onlyIDA totalIndiaIndonesiaIran, Islamic Rep.IraqIrelandIsraelItalyJamaicaJapanJordanKazakhstanKenyaKiribatiKorea, Dem. People’s Rep.Korea, Rep.KuwaitKyrgyz RepublicLao PDRLate-demographic dividendLatin America & Caribbean Latin America & Caribbean (excluding high income)Latin America & the Caribbean (IDA & IBRD countries)LatviaLeast developed countries: UN classificationLebanonLesothoLiberiaLibyaLithuaniaLow & middle incomeLow incomeLower middle incomeLuxembourgMacao SAR, ChinaMacedonia, FYRMadagascarMalawiMalaysiaMaldivesMaliMaltaMarshall IslandsMauritaniaMauritiusMexicoMiddle East & North AfricaMiddle East & North Africa (excluding high income)Middle East & North Africa (IDA & IBRD countries)Middle incomeMoldovaMonacoMongoliaMontenegroMoroccoMozambiqueMyanmarNamibiaNauruNepalNetherlandsNew ZealandNicaraguaNigerNigeriaNorth AmericaNorwayOECD membersOmanOther small statesPacific island small statesPakistanPanamaPapua New GuineaParaguayPeruPhilippinesPolandPortugalPost-demographic dividendPre-demographic dividendQatarRomaniaRussian FederationRwandaSamoaSao Tome and PrincipeSaudi ArabiaSenegalSerbiaSeychellesSierra LeoneSingaporeSlovak RepublicSloveniaSmall statesSolomon IslandsSomaliaSouth AfricaSouth AsiaSouth Asia (IDA & IBRD)SpainSri LankaSub-Saharan Africa Sub-Saharan Africa (excluding high income)Sub-Saharan Africa (IDA & IBRD countries)SudanSurinameSwazilandSwedenSwitzerlandSyrian Arab RepublicTajikistanTanzaniaThailandTogoTongaTrinidad and TobagoTunisiaTurkeyTurkmenistanUgandaUkraineUnited Arab EmiratesUnited KingdomUnited StatesUpper middle incomeUruguayUzbekistanVanuatuVenezuela, RBVietnamWorldYemen, Rep.ZambiaZimbabwe Timeline:
This timeline shows a graph from 1971 to 2016 of Myanmar. No data until 1970. Number of actual observations by date: 46.
Source name:
World Development Indicators
Source organization:
International Civil Aviation Organization, Civil Aviation Statistics of the World and ICAO staff estimates.
Categories, topics:
Infrastructure
Last updated:
apr 23, 2017
Indicators value changes by year
Minimum:
308.0K
jan 1, 1990
Maximum:
2.029 mln
jan 1, 2016
At the date of observation
Value
Absolute change
Change from previous value
jan 1, 1971
345.8K
+345.8K
0.0%
jan 1, 1972
380.5K
+34.7K
10.03%
jan 1, 1973
393.0K
+12.5K
3.29%
jan 1, 1974
405.0K
+12.0K
3.05%
jan 1, 1975
388.3K
-16.7K
-4.12%
jan 1, 1976
391.3K
+3.0K
0.77%
jan 1, 1977
396.0K
+4.7K
1.2%
jan 1, 1978
410.0K
+14.0K
3.54%
jan 1, 1979
425.0K
+15.0K
3.66%
jan 1, 1980
460.0K
+35.0K
8.24%
jan 1, 1981
481.0K
+21.0K
4.57%
jan 1, 1982
500.0K
+19.0K
3.95%
jan 1, 1983
515.0K
+15.0K
3.0%
jan 1, 1984
517.0K
+2.0K
0.39%
jan 1, 1985
487.0K
-30.0K
-5.8%
jan 1, 1986
509.0K
+22.0K
4.52%
jan 1, 1987
511.0K
+2.0K
0.39%
jan 1, 1988
512.0K
+1000.0
0.2%
jan 1, 1989
516.0K
+4.0K
0.78%
jan 1, 1990
308.0K
-208.0K
-40.31%
jan 1, 1991
318.5K
+10.5K
3.41%
jan 1, 1992
318.5K
0.0
0.0%
jan 1, 1993
318.5K
0.0
0.0%
jan 1, 1994
318.5K
0.0
0.0%
jan 1, 1995
318.5K
0.0
0.0%
jan 1, 1996
334.5K
+16.0K
5.02%
jan 1, 1997
334.5K
0.0
0.0%
jan 1, 1998
334.5K
0.0
0.0%
jan 1, 1999
333.2K
-1.3K
-0.39%
jan 1, 2000
536.8K
+203.6K
61.1%
jan 1, 2001
437.6K
-99.2K
-18.48%
jan 1, 2002
398.216K
-39.384K
-9.0%
jan 1, 2003
1.186 mln
+787.946K
197.87%
jan 1, 2004
1.117 mln
-68.954K
-5.81%
jan 1, 2005
1.392 mln
+275.036K
24.62%
jan 1, 2006
1.504 mln
+111.38K
8.0%
jan 1, 2007
1.621 mln
+117.271K
7.8%
jan 1, 2008
1.663 mln
+41.971K
2.59%
jan 1, 2009
1.638 mln
-24.943K
-1.5%
jan 1, 2010
1.527 mln
-110.577K
-6.75%
jan 1, 2011
924.207K
-603.139K
-39.49%
jan 1, 2012
1.54 mln
+615.469K
66.59%
jan 1, 2013
1.663 mln
+123.749K
8.04%
jan 1, 2014
1.572 mln
-91.305K
-5.49%
jan 1, 2015
1.899 mln
+326.628K
20.78%
jan 1, 2016
2.029 mln
+130.392K
6.87%
Ranking of countries by current statistics by years


Comments: