29
/
en
AIzaSyAYiBZKx7MnpbEhh9jyipgxe19OcubqV5w
April 1, 2024
274532
United Arab Emirates
ARE
true
2
1
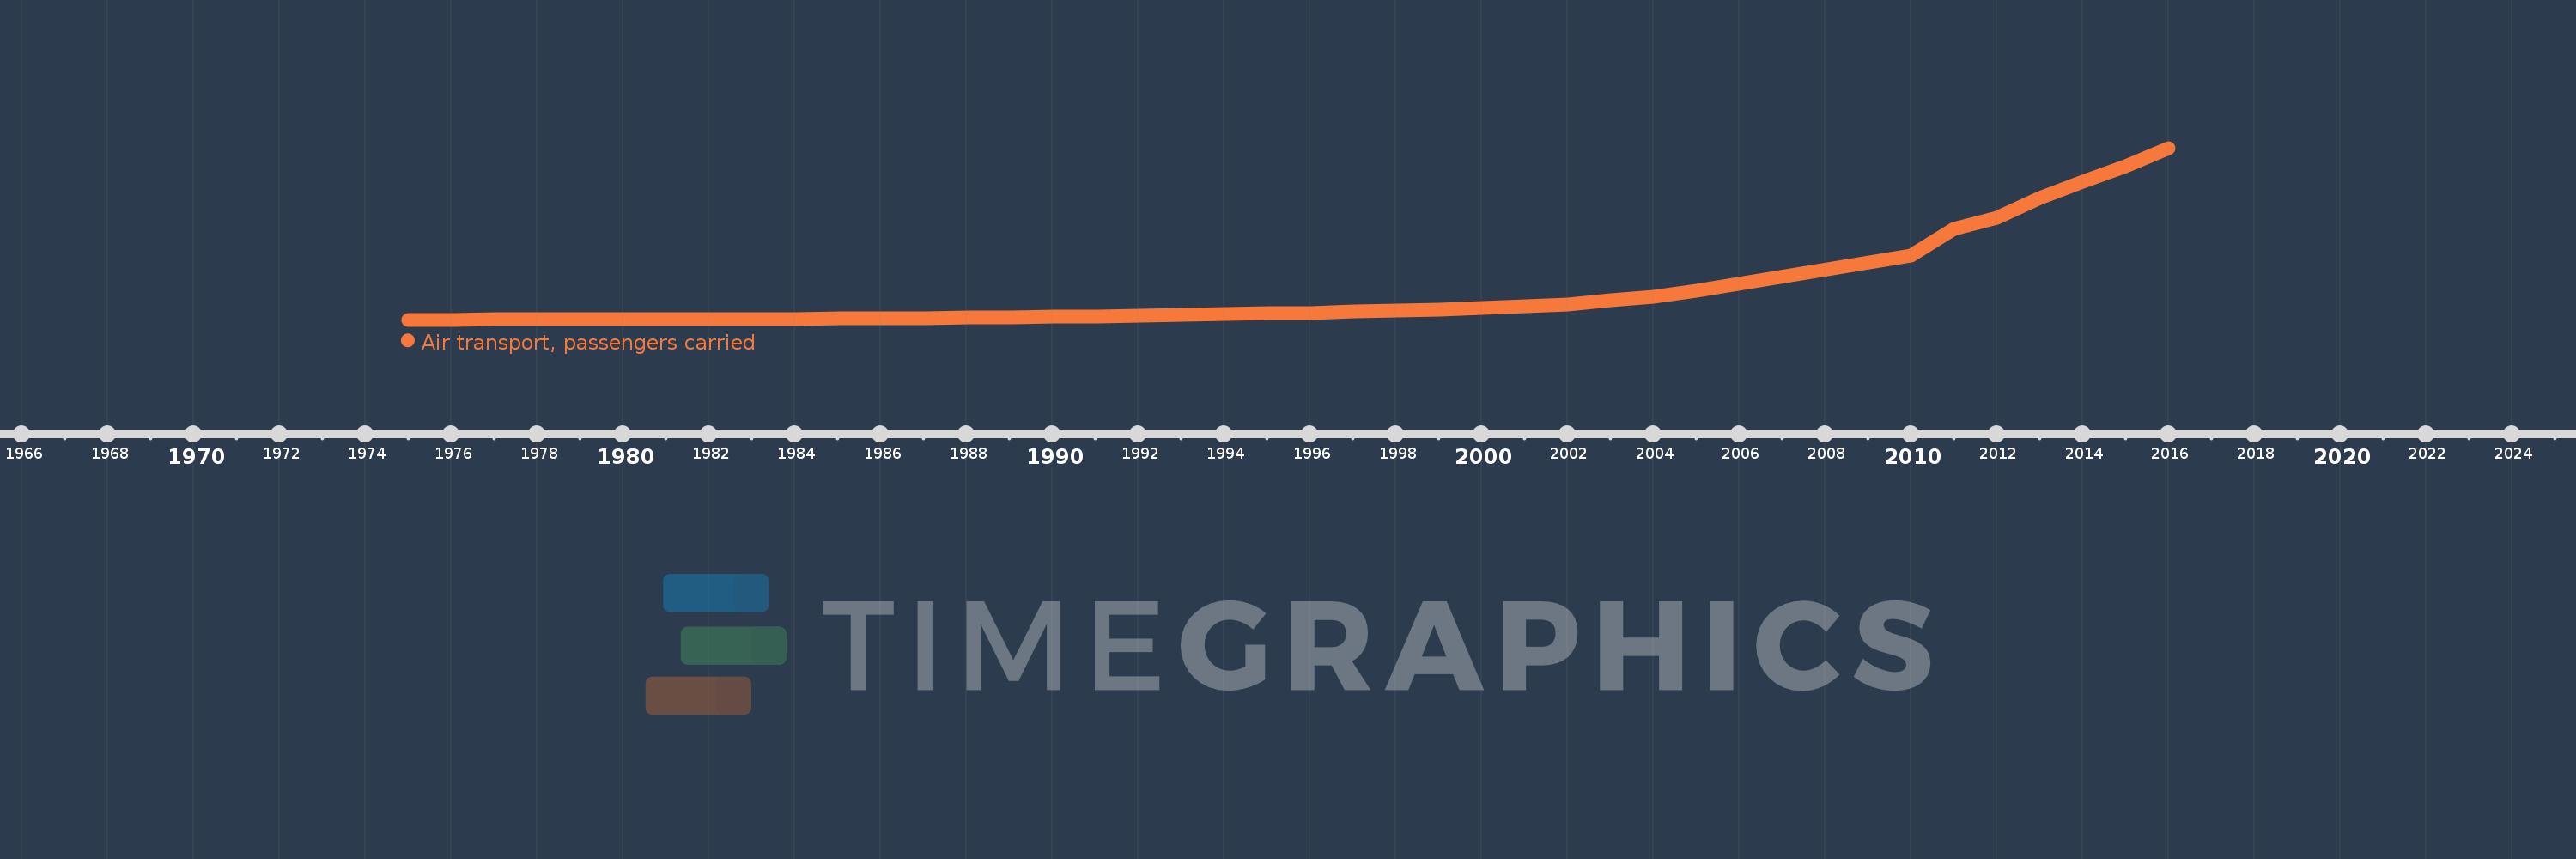
Air transport, passengers carried
2016,2015,2014,2013,2012,2011,2010,2005,2004,2003,2002,2001,2000,1999,1998,1997,1996,1995,1994,1993,1992,1991,1990,1989,1988,1987,1986,1985,1984,1983,1982,1981,1980,1979,1978,1977,1976,1975
This statistics in other country:
AfghanistanAlbaniaAlgeriaAmerican SamoaAngolaAntigua and BarbudaArab WorldArgentinaArmeniaAustraliaAustriaAzerbaijanBahamas, TheBahrainBangladeshBarbadosBelarusBelgiumBelizeBeninBhutanBoliviaBosnia and HerzegovinaBotswanaBrazilBrunei DarussalamBulgariaBurkina FasoBurundiCabo VerdeCambodiaCameroonCanadaCaribbean small statesCentral African RepublicCentral Europe and the BalticsChadChileChinaColombiaComorosCongo, Dem. Rep.Congo, Rep.Costa RicaCote d'IvoireCroatiaCubaCyprusCzech RepublicDenmarkDjiboutiDominican RepublicEarly-demographic dividendEast Asia & PacificEast Asia & Pacific (excluding high income)East Asia & Pacific (IDA & IBRD countries)EcuadorEgypt, Arab Rep.El SalvadorEquatorial GuineaEritreaEstoniaEthiopiaEuro areaEurope & Central AsiaEurope & Central Asia (excluding high income)Europe & Central Asia (IDA & IBRD countries)European UnionFijiFinlandFragile and conflict affected situationsFranceGabonGambia, TheGeorgiaGermanyGhanaGreeceGuamGuatemalaGuineaGuinea-BissauGuyanaHaitiHeavily indebted poor countries (HIPC)High incomeHondurasHong Kong SAR, ChinaHungaryIBRD onlyIcelandIDA & IBRD totalIDA blendIDA onlyIDA totalIndiaIndonesiaIran, Islamic Rep.IraqIrelandIsraelItalyJamaicaJapanJordanKazakhstanKenyaKiribatiKorea, Dem. People’s Rep.Korea, Rep.KuwaitKyrgyz RepublicLao PDRLate-demographic dividendLatin America & Caribbean Latin America & Caribbean (excluding high income)Latin America & the Caribbean (IDA & IBRD countries)LatviaLeast developed countries: UN classificationLebanonLesothoLiberiaLibyaLithuaniaLow & middle incomeLow incomeLower middle incomeLuxembourgMacao SAR, ChinaMacedonia, FYRMadagascarMalawiMalaysiaMaldivesMaliMaltaMarshall IslandsMauritaniaMauritiusMexicoMiddle East & North AfricaMiddle East & North Africa (excluding high income)Middle East & North Africa (IDA & IBRD countries)Middle incomeMoldovaMonacoMongoliaMontenegroMoroccoMozambiqueMyanmarNamibiaNauruNepalNetherlandsNew ZealandNicaraguaNigerNigeriaNorth AmericaNorwayOECD membersOmanOther small statesPacific island small statesPakistanPanamaPapua New GuineaParaguayPeruPhilippinesPolandPortugalPost-demographic dividendPre-demographic dividendQatarRomaniaRussian FederationRwandaSamoaSao Tome and PrincipeSaudi ArabiaSenegalSerbiaSeychellesSierra LeoneSingaporeSlovak RepublicSloveniaSmall statesSolomon IslandsSomaliaSouth AfricaSouth AsiaSouth Asia (IDA & IBRD)SpainSri LankaSub-Saharan Africa Sub-Saharan Africa (excluding high income)Sub-Saharan Africa (IDA & IBRD countries)SudanSurinameSwazilandSwedenSwitzerlandSyrian Arab RepublicTajikistanTanzaniaThailandTogoTongaTrinidad and TobagoTunisiaTurkeyTurkmenistanUgandaUkraineUnited Arab EmiratesUnited KingdomUnited StatesUpper middle incomeUruguayUzbekistanVanuatuVenezuela, RBVietnamWorldYemen, Rep.ZambiaZimbabwe Timeline:
This timeline shows a graph from 1975 to 2016 of United Arab Emirates. No data until 1974. Number of actual observations by date: 38.
Source name:
World Development Indicators
Source organization:
International Civil Aviation Organization, Civil Aviation Statistics of the World and ICAO staff estimates.
Categories, topics:
Infrastructure
Last updated:
apr 23, 2017
Indicators value changes by year
Minimum:
127.5K
jan 1, 1975
Maximum:
84.738 mln
jan 1, 2016
At the date of observation
Value
Absolute change
Change from previous value
jan 1, 1975
127.5K
+127.5K
0.0%
jan 1, 1976
173.0K
+45.5K
35.69%
jan 1, 1977
240.1K
+67.1K
38.79%
jan 1, 1978
299.8K
+59.7K
24.86%
jan 1, 1979
374.5K
+74.7K
24.92%
jan 1, 1980
456.5K
+82.0K
21.9%
jan 1, 1981
521.5K
+65.0K
14.24%
jan 1, 1982
577.8K
+56.3K
10.8%
jan 1, 1983
569.8K
-8.0K
-1.38%
jan 1, 1984
601.8K
+32.0K
5.62%
jan 1, 1985
674.2K
+72.4K
12.03%
jan 1, 1986
717.5K
+43.3K
6.42%
jan 1, 1987
935.2K
+217.7K
30.34%
jan 1, 1988
1.093 mln
+157.8K
16.87%
jan 1, 1989
1.329 mln
+236.5K
21.64%
jan 1, 1990
1.482 mln
+152.2K
11.45%
jan 1, 1991
1.686 mln
+204.2K
13.78%
jan 1, 1992
2.042 mln
+355.9K
21.11%
jan 1, 1993
2.509 mln
+467.0K
22.87%
jan 1, 1994
2.936 mln
+427.5K
17.04%
jan 1, 1995
3.369 mln
+432.4K
14.73%
jan 1, 1996
3.55 mln
+181.8K
5.4%
jan 1, 1997
4.064 mln
+513.0K
14.45%
jan 1, 1998
4.72 mln
+656.9K
16.17%
jan 1, 1999
5.264 mln
+543.3K
11.51%
jan 1, 2000
5.84 mln
+576.6K
10.95%
jan 1, 2001
6.893 mln
+1.053 mln
18.03%
jan 1, 2002
7.676 mln
+782.76K
11.36%
jan 1, 2003
9.667 mln
+1.991 mln
25.94%
jan 1, 2004
11.61 mln
+1.943 mln
20.1%
jan 1, 2005
14.314 mln
+2.704 mln
23.29%
jan 1, 2010
31.762 mln
+17.447 mln
121.89%
jan 1, 2011
44.948 mln
+13.187 mln
41.52%
jan 1, 2012
50.343 mln
+5.395 mln
12.0%
jan 1, 2013
59.949 mln
+9.606 mln
19.08%
jan 1, 2014
68.152 mln
+8.203 mln
13.68%
jan 1, 2015
75.608 mln
+7.456 mln
10.94%
jan 1, 2016
84.738 mln
+9.13 mln
12.08%
Ranking of countries by current statistics by years


Comments: